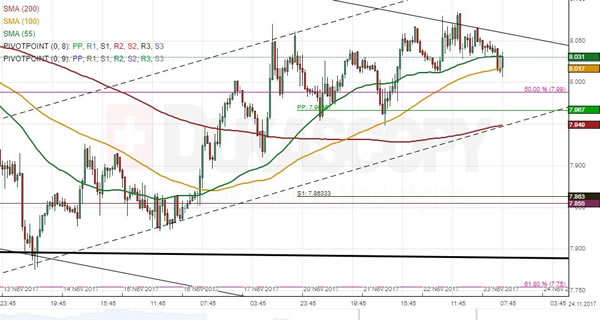
Downside risks have dominated ZAR/JPY both in the long and medium term. The most senior pattern is a falling wedge in force since late November, 2016. A more recent bearish pattern is a three-month channel down that guided the rate from one wedge boundary to the other. After testing the 7.80 mark, the South African Rand began a new wave up in the medium pattern—a move which is constrained by a minor channel up. As apparent on the chart, the rate is currently testing this short-term pattern and it seems that a breakout to the downside might be successful. This assumption is also supported by technical indicators. The rate is likely to remain near the weekly PP and the 200-hour SMA circa 7.69 during this week and subsequently edge even lower down to the weekly and monthly S1s near 7.86. It is expected that the bottom boundary of the medium-term channel would not be reached, as the Rand should push for the upper wedge boundary during the following weeks.