Hello fellow traders. In this technical article we’re going to look at the Elliott Wave charts of Dollar Index DXY published in members area of the website. As our members know, DXY is forming a correction against the 103.56 peak. In the following text, we’ll explain the Elliott Wave analysis and outline the target areas.
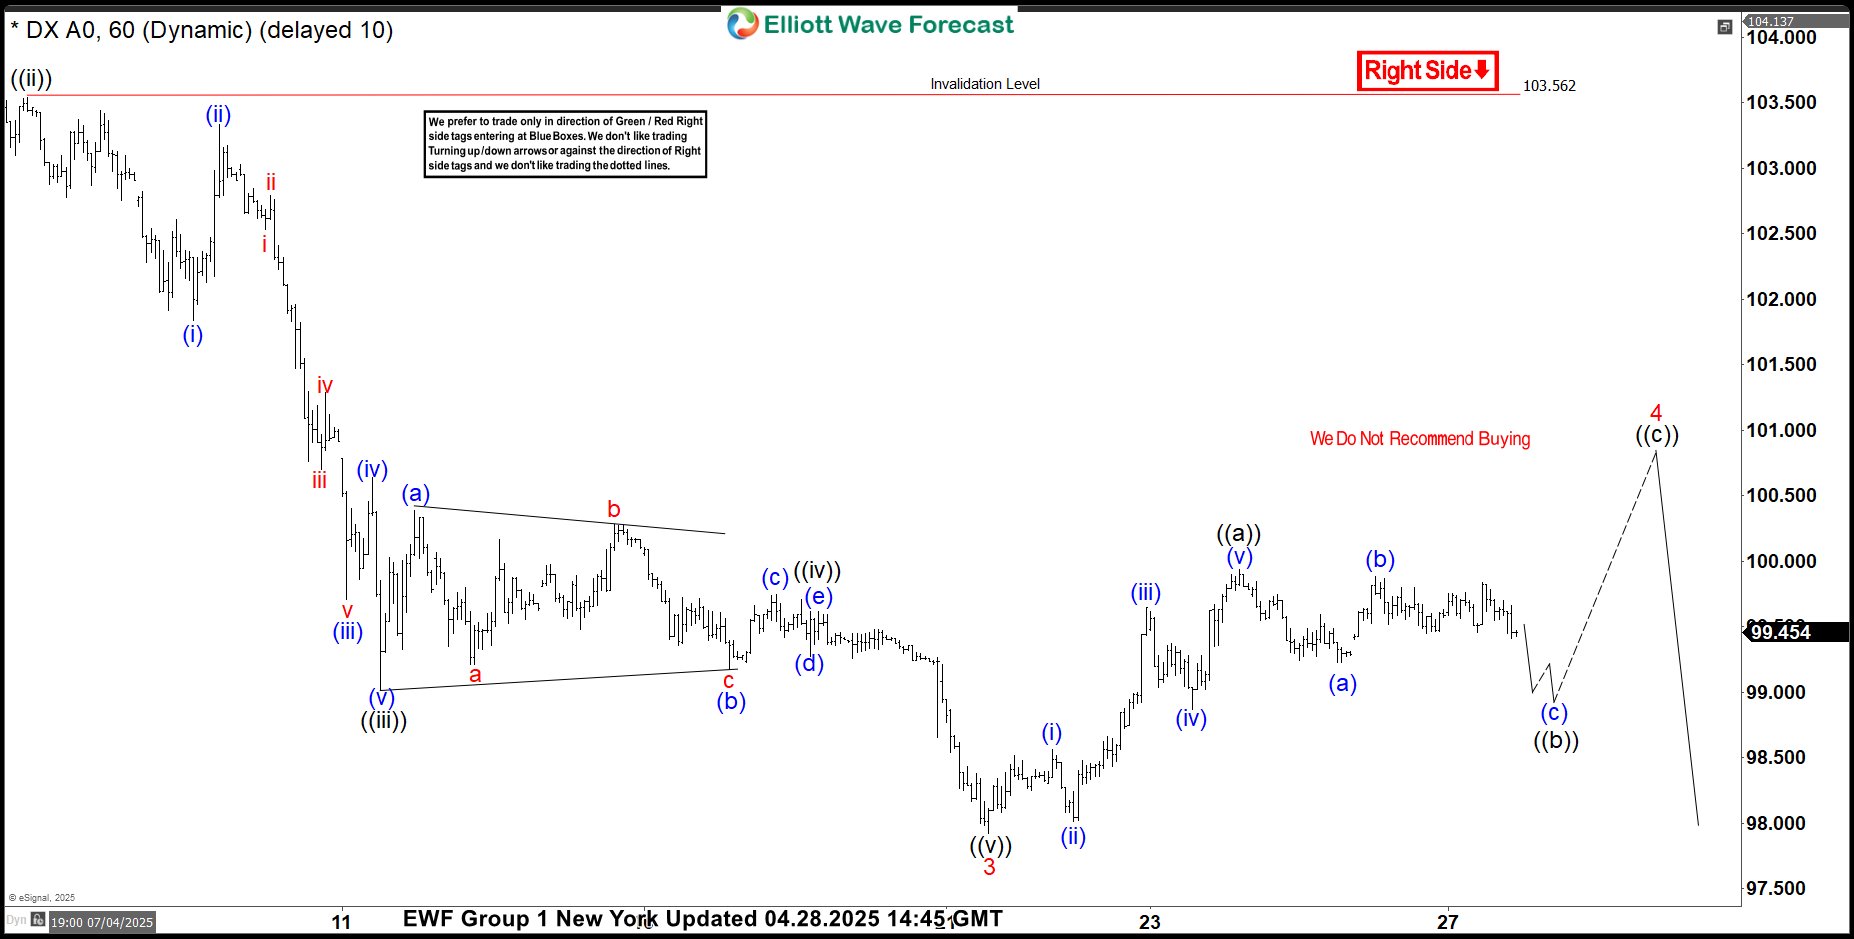
DXY Elliott Wave 1 Hour Chart 04.28.2025
The current view suggests that the US Dollar Index is correcting the cycle from the 103.56 peak.We count five waves in the rally from the low, indicating that we have completed only the first leg of a potential correction, labeled as wave ((a)) in black.
The market is currently forming wave ((b)), which could reach the 99.18–98.75 area.In this zone, we expect buyers to appear for a potential final push higher in wave ((c)), as proposed on the chart.
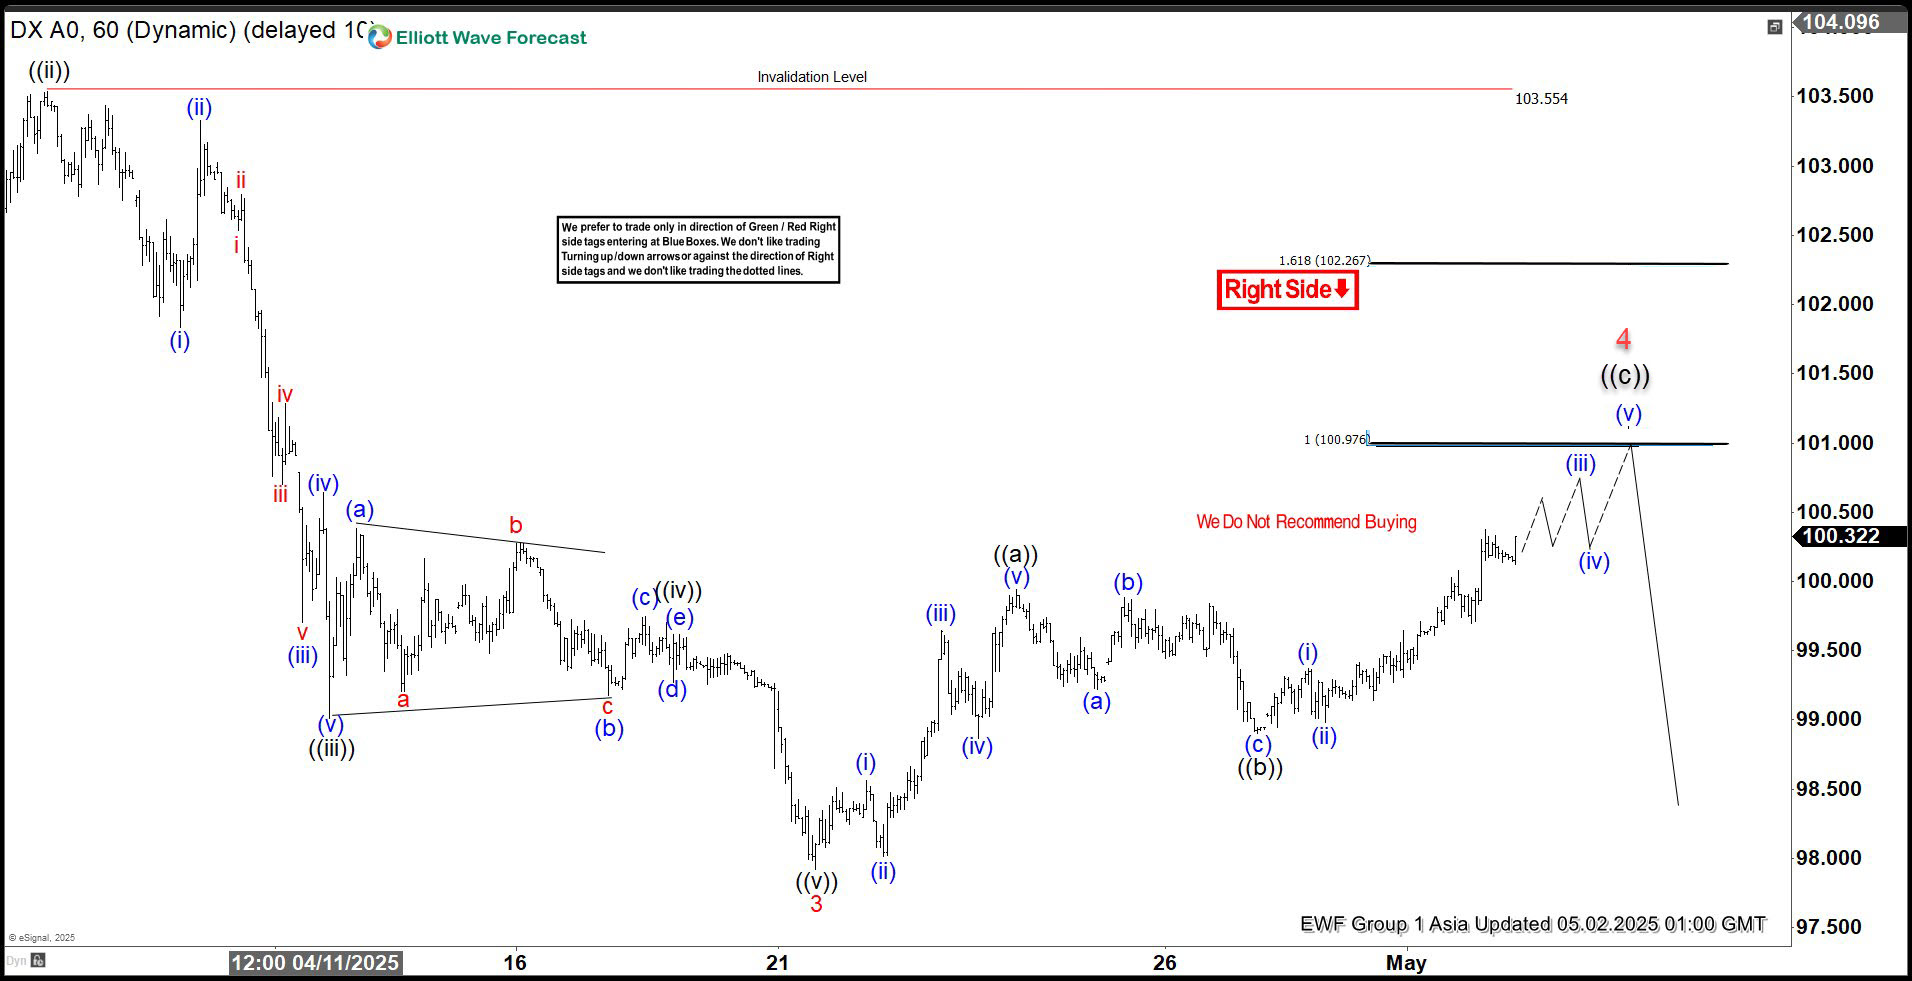
DXY Elliott Wave 1 Hour Chart 04.28.2025
Dollar found buyers at 99.18–98.75 area as expected. It made decent rally that broke the previous peak ((a)) , confirming that the next leg up is in progress – ((c)). Dollar can see 100.97-102.26 area before sellers appear again.