
Gold price started a fresh increase above the $3,210 resistance level. WTI Crude oil prices are gaining bullish momentum and might even test $63.50.
Important Takeaways for Gold and WTI Crude Oil Prices Analysis Today
- Gold price started a steady increase from the $3,120 zone against the US Dollar.
- A connecting bullish trend line is forming with support at $3,210 on the hourly chart of gold at FXOpen.
- WTI Crude climbed above the $60.90 and $61.50 resistance levels.
- There is a key rising channel forming with support at $61.30 on the hourly chart of XTI/USD at FXOpen.
Gold Price Technical Analysis
On the hourly chart of Gold at FXOpen, the price found support near the $3,120 zone. The price formed a base and started a fresh increase above the $3,150 level.
The bulls cleared the $3,200 zone and the 50-hour simple moving average. There was also a spike above the 50% Fib retracement level of the downward move from the $3,347 swing high to the $3,120 low. The RSI is now above 50 and the price could aim for more gains.
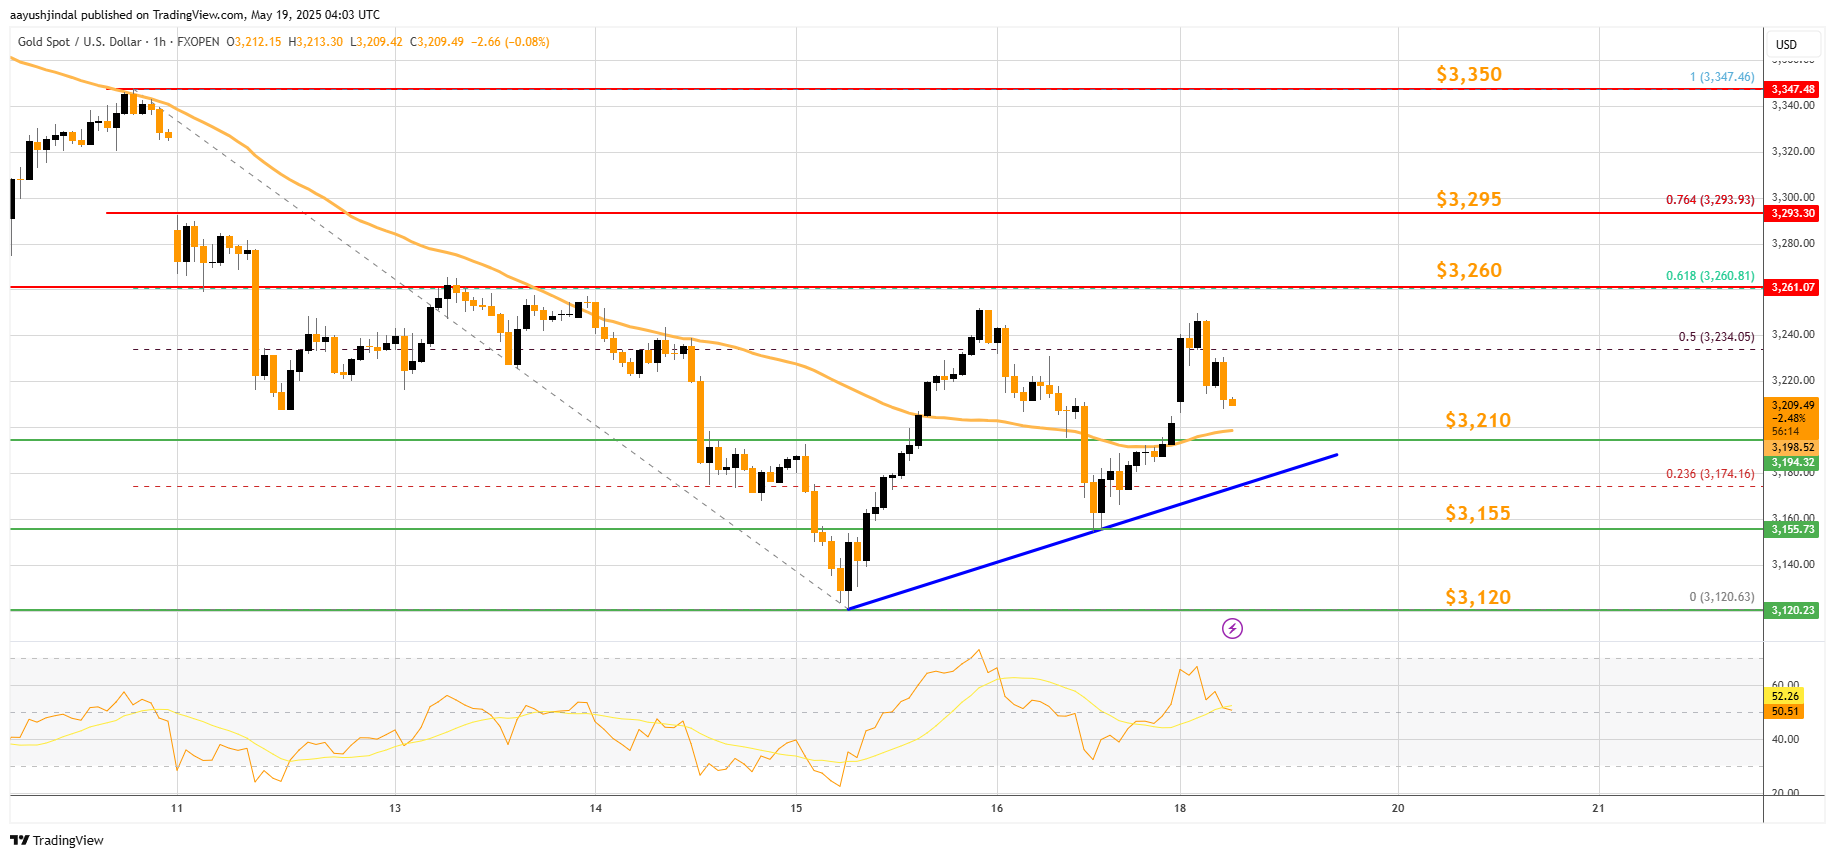
Immediate resistance is near the 61.8% Fib retracement level of the downward move from the $3,347 swing high to the $3,120 low at $3,260.
The next major resistance is near the $3,295 level. An upside break above the $3,295 resistance could send Gold price toward $3,350. Any more gains may perhaps set the pace for an increase toward the $3,385 level.
Initial support on the downside is near the $3,210 zone. There is also a connecting bullish trend line forming with support at $3,210. If there is a downside break below the $3,210 support, the price might decline further.
In the stated case, the price might drop toward the $3,155 support. The next major support sits at $3,120. Any more losses might send the price toward the $3,060 level.
WTI Crude Oil Price Technical Analysis
On the hourly chart of WTI Crude Oil at FXOpen, the price started a fresh upward move from $60.10 against the US Dollar. The price gained bullish momentum after it broke the $60.90 resistance.
The bulls pushed the price above the 50% Fib retracement level of the downward move from the $63.45 swing high to the $60.08 low. The price even climbed above the 50-hour simple moving average.
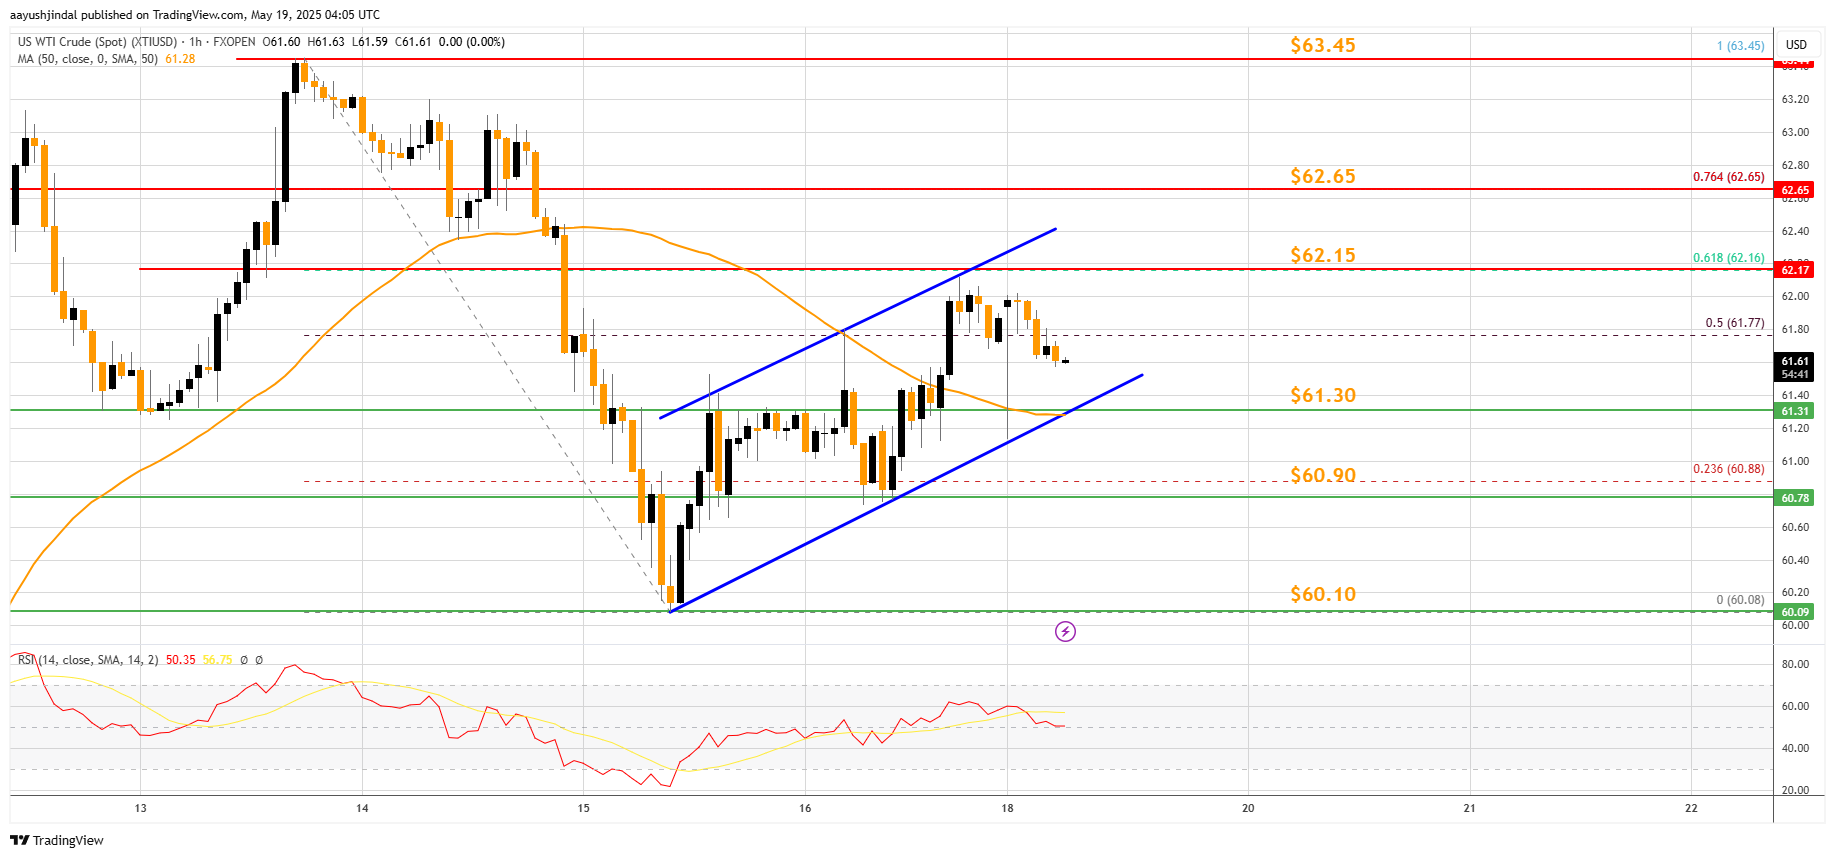
It tested the $62.15 resistance zone and the 61.8% Fib retracement level of the downward move from the $63.45 swing high to the $60.08 low. There is now a key rising channel forming with support at $61.30.
The RSI is now near the 50 level and the price could aim for more gains. If the price climbs higher again, it could face resistance near $62.15. The next major resistance is near the $62.65 level. Any more gains might send the price toward the $63.45 level or even $65.00.
Conversely, the price might correct gains and test the $61.30 support level. The next major support on the WTI crude oil chart is near the $60.90 zone, below which the price could test the $60.10 zone.
If there is a downside break, the price might decline toward $58.50. Any more losses may perhaps open the doors for a move toward the $55.50 support zone.
Start trading commodity CFDs with tight spreads. Open your trading account now or learn more about trading commodity CFDs with FXOpen.
This article represents the opinion of the Companies operating under the FXOpen brand only. It is not to be construed as an offer, solicitation, or recommendation with respect to products and services provided by the Companies operating under the FXOpen brand, nor is it to be considered financial advice.


