
- EUR/USD is showing bullish momentum on the weekly chart with a potential bullish engulfing candle, suggesting further gains and possible new yearly highs.
- On the daily chart, a close above 1.1366 is needed for a structural change.
- The RSI on the daily timeframe indicates a bullish bias, but a US Dollar recovery could trigger a pullback in EUR/USD.
EUR/USD is enjoying a good run this week despite weak PMI data reigniting stagflation concerns. However, US Dollar weakness continues to help the Euro as it trades around 1.6% higher against the greenback.
The performance of the Euro has surprised me to say the least. This morning we saw traders fully price ECB rate cuts in April for the first time. This was followed by Morgan Stanley lowering the Euro area’s 2025 GDP forecast to 0.8% vs prior forecast of 1.0% while also saying that they expect the ECB benchmark rate to reach 1.5% in December 2025 vs the prior forecast of June 2026.
It is no surprise then that the rally in EUR/USD has largely been driven by US Dollar weakness as was evident this week. Weak Euro Area data was once again ignored as the US Dollar continued its struggles.
The technicals are also painting an interesting picture so let’s take a look.
Technical Analysis on EUR/USD
Let us start with the technical picture on the weekly chart.
As you can see below, the recent pullback in EURUSD appears to have found support with last week’s candle closing as a doji indecision candle at the trendline which was broken on April 7.
This was a sign that a potential reversal may be incoming this week and that has come to fruition thus far as the US Dollar struggled.
EUR/USD is currently up around 1.6% for the week with the weekly candle on course to close as a bullish engulfing candle. At present, the weekly candle is on course to engulf the past three weeks of bearish price action hinting at significant buying pressure.
Looking at this picture and further gains at this stage look likely with fresh yearly highs also not out of the question.
EUR/USD Weekly Chart, May 23, 2025
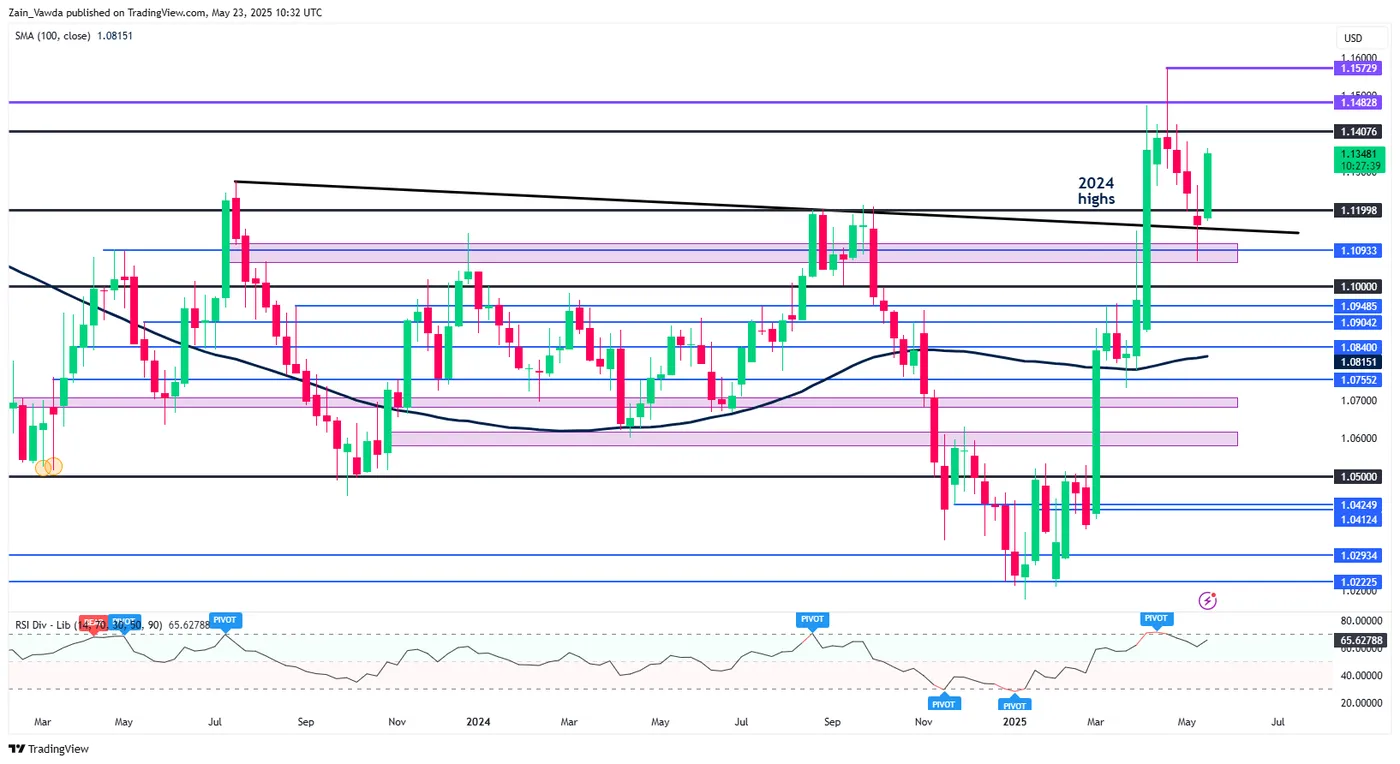
Source: TradingView.com
On the daily chart below, the swing high at 1.1366 needs to be broken with a daily candle close above this level needed for a change in structure.
If such a move develops this may embolden bulls further that the rally has the legs to take out the April 21 highs at 1.1572.
Beyond the 1.1366 handle, there is also resistance around the 1.1400 level and 1.1482 which could prove a challenge for bulls to overcome.
The RSI period – 14 on the daily timeframe though also appears to support a bullish narrative for now. Having broken back above the neutral 50 level on May 19, this supports the idea that momentum is currently favoring a bullish bias.
However, indicators are not always correct and thus a pullback cannot be ruled out if the US dollar finds support next week.
EUR/USD Daily Chart, May 23, 2025
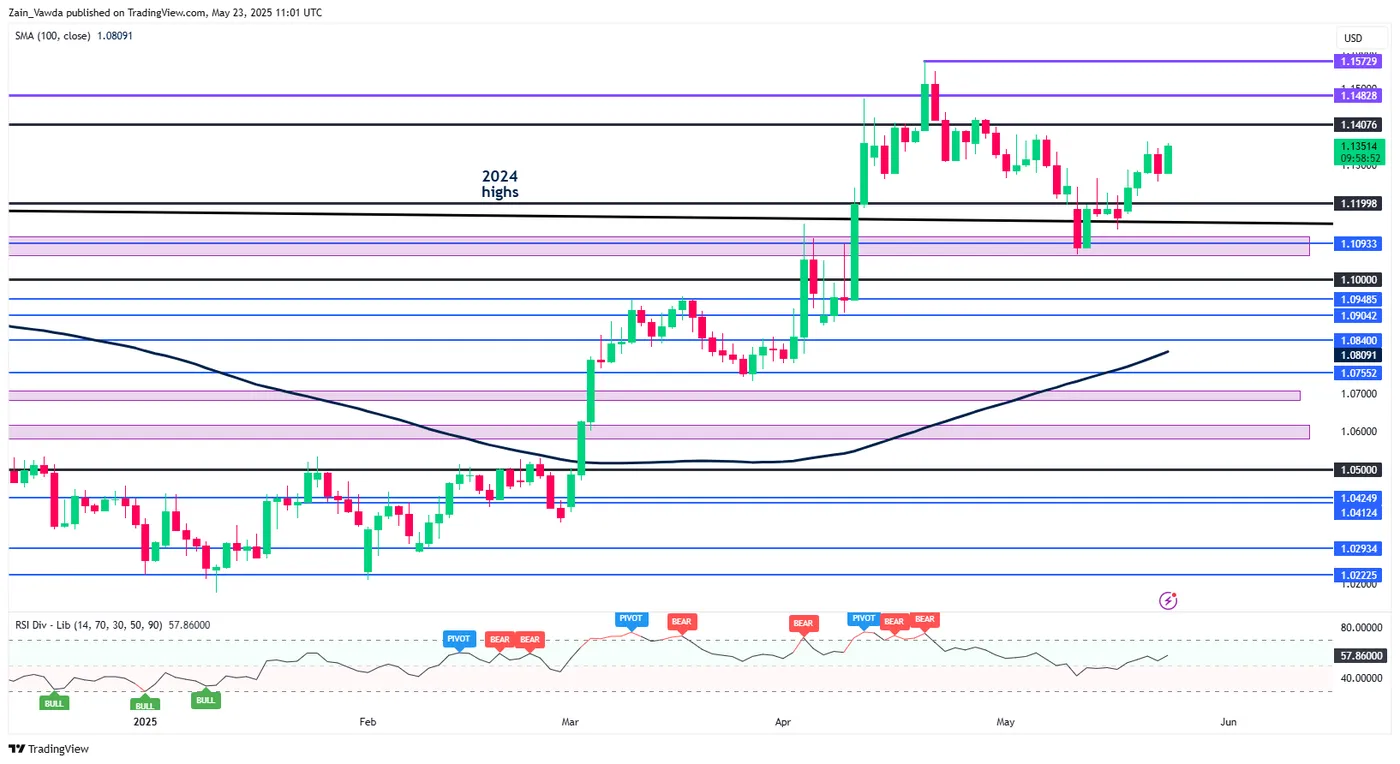
Source: TradingView.com
Support
- 1.1270
- 1.1200
- 1.1100
Resistance
- 1.1366
- 1.1400
- 1.1482


