
Gold (XAUUSD) has displayed a strong bullish trend since establishing a low on May 15, 2025, forming a sequence of higher highs that signals further upside potential. The rally from the May 15 low unfolded in a clear five-wave Elliott Wave structure, completing wave 1 at $3365.93. The initial advance, wave ((i)), peaked at $3252.05, followed by a corrective pullback in wave ((ii)) to $3153.47. The subsequent rally in wave ((iii)) reached $3345.40, with a minor dip in wave ((iv)) to $3278.79. A final leg, wave ((v)), concluded wave 1 at $3365.93.
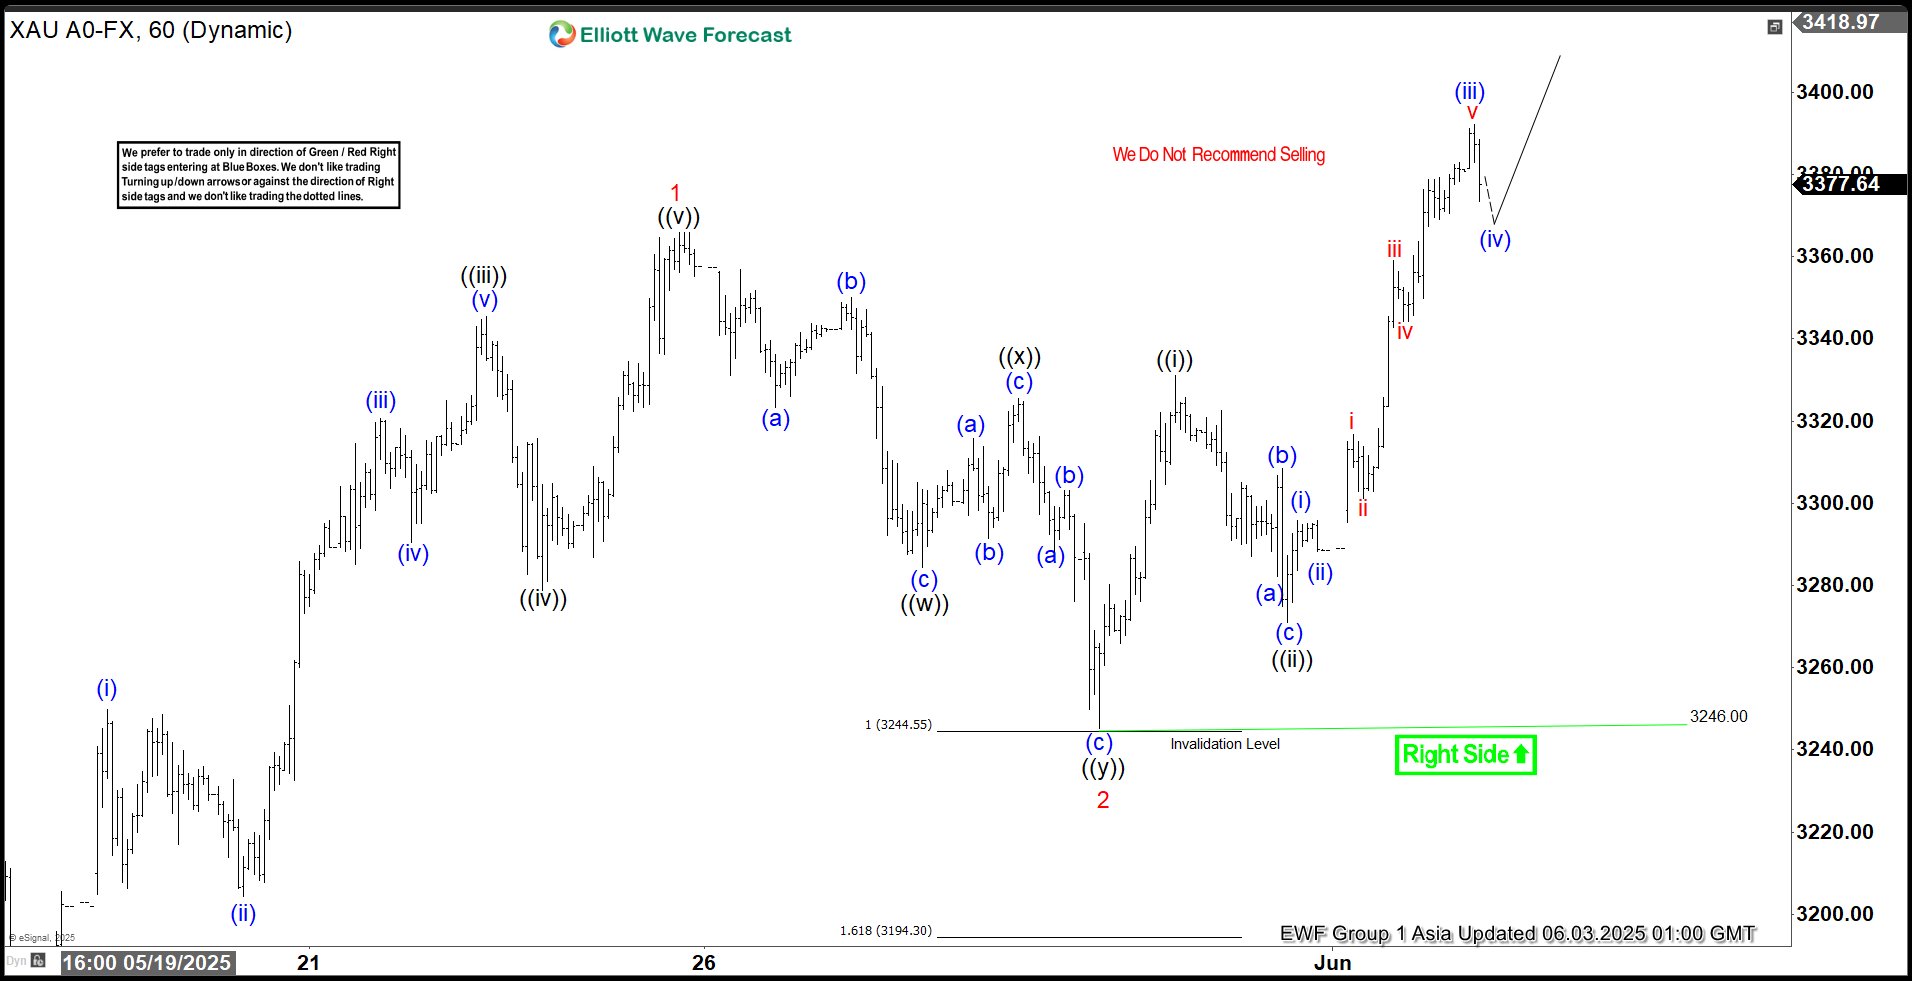
Following the completion of wave 1, a corrective wave 2 developed as a double three Elliott Wave structure. From the wave 1 high, wave ((w)) declined to $3284.40, followed by a recovery in wave ((x)) to $3325.51. The subsequent decline in wave ((y)) bottomed at $3245.20, marking the end of wave 2. Gold then resumed its upward trajectory, initiating wave 3. Within this wave, wave ((i)) peaked at $3331.11, and a pullback in wave ((ii)) found support at $3271.09. The metal has since broken above the previous wave 1 high of $3365.93, confirming the start of wave ((iii)) and signaling further upside.
In the near term, as long as the pivot low at $3246 remains intact, pullbacks are expected to attract buyers in a 3, 7, or 11-swing corrective structure, supporting additional gains. Traders should monitor these levels for potential buying opportunities, with the bullish trend likely to persist as long as key support holds.
Gold 60-Minute Elliott Wave Technical Chart
Gold (XAUUSD) Elliott Wave Technical Video
You are currently viewing a placeholder content from Default. To access the actual content, click the button below. Please note that doing so will share data with third-party providers.


 has displayed a strong bullish trend since establishing a low on May 15, 2025, forming a sequence of higher highs that signals further upside potential. The rally from the May 15 low unfolded in a clear five-wave Elliott Wave structure, completing wave 1 at $3365.93. The initial advance, wave ((i)), peaked at $3252.05, followed by a corrective pullback in wave ((ii)) to $3153.47. The subsequent rally in wave ((iii)) reached $3345.40, with a minor dip in wave ((iv)) to $3278.79. A final leg, wave ((v)), concluded wave 1 at $3365.93.)