
Key Takeaways
- Nasdaq 100 extended its medium-term bullish trend to a fresh record high of 29,390, supported largely by explosive gains in semiconductor and AI-related stocks such as Intel, Advanced Micro Devices, and SanDisk.
- The strong correlation between the Nasdaq 100 and the iShares Semiconductor ETF suggests that emerging exhaustion signals in semiconductor stocks could trigger a near-term corrective pullback in the broader tech-heavy index.
- Bearish technical indicators, including bearish RSI divergence, overstretched price action above the 20-day moving average, and Bollinger Band exhaustion conditions, point to rising risks of a short-term mean reversion decline below the 29,505/615 resistance zone.
The price actions of the US Nasdaq CFD index, a proxy of the Nasdaq 100 E-mini futures, have surged as expected. It rallied by 3.2% from Friday, 8 May 2026 intraday low of 28,480 to hit a fresh all-time intraday high of 29,390 on Monday, 11 May 2026 in the US session.
Its current medium-term uptrend phase has been in place since the 30 March 2026 low, and a significant contribution of the gains has come from US semiconductor and AI-hardware-related stocks, such as SanDisk, up 151%, Intel, up 150%, and Advanced Micro Devices, up 105%, in the past three months.
US Semiconductors Are Showing Signs of Medium-Term Bullish Exhaustion
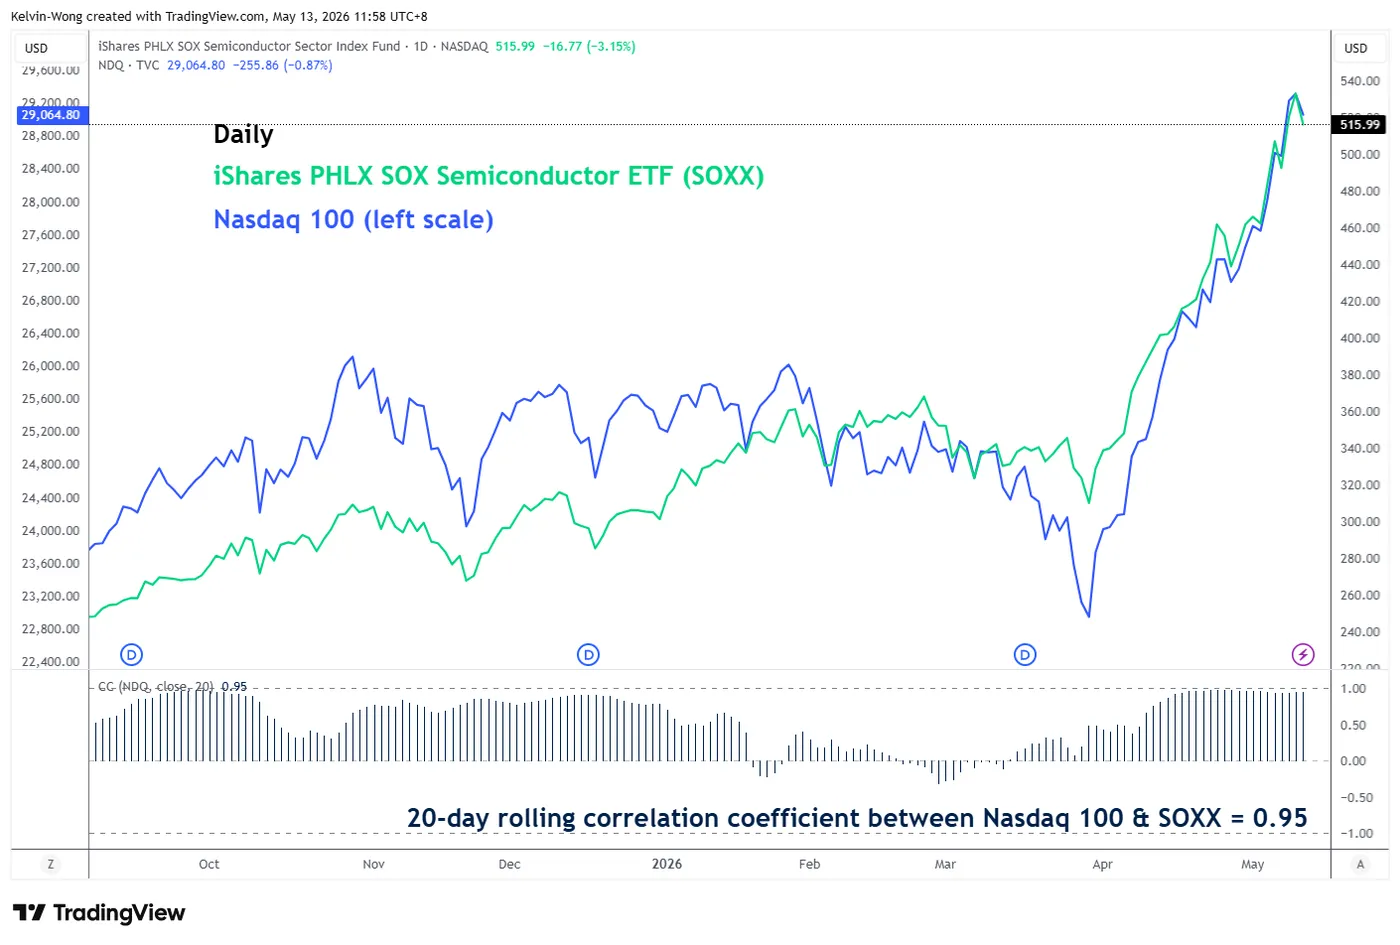
Fig. 1: Correlation of iShares PHLX SOX Semiconductor ETF, SOXX, with Nasdaq 100 as of 12 May 2026. Source: TradingView.
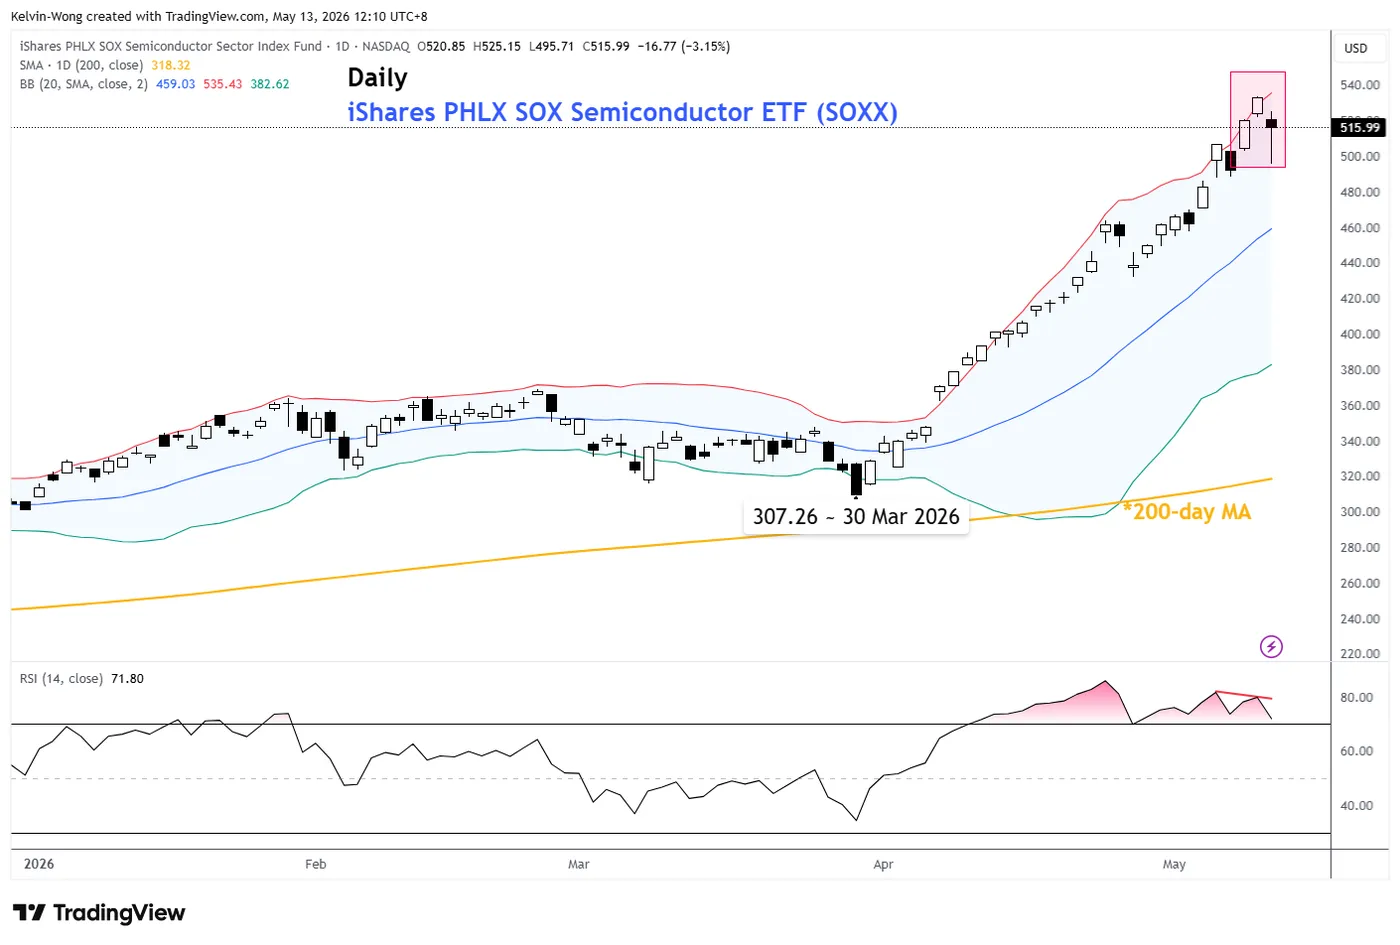
Fig. 2: iShares PHLX SOX Semiconductor ETF, SOXX, medium-term trend as of 12 May 2026. Source: TradingView.
The price movement of the Nasdaq 100 and the iShares Philadelphia, PHLX, Semiconductor Sector exchange-traded fund, SOXX, has moved in almost perfect direct lockstep.
The 20-day rolling coefficient between the Nasdaq 100 and SOXX stands at 0.95, which indicates that future movements of US semiconductor stocks, using SOXX as a bellwether, are likely to have a significant influence and impact on the Nasdaq 100.
The prior 6-week consecutive rally of the SOXX has reached an overstretched volatility condition, as seen in the daily Bollinger Bands indicator.
The daily price action of SOXX had a daily close above the upper Bollinger Band, two standard deviations away from the 20-day moving average, on Monday, 11 May 2026, coupled with a bearish divergence condition seen on the daily RSI momentum indicator at its overbought zone.
These observations suggest the bullish impulsive up move of SOXX since the 30 March 2026 low has reached a potential bullish exhaustion condition, where the next movement may be a multi-day corrective decline sequence, in turn triggering a negative feedback loop into the Nasdaq 100.
Let’s now uncover the short-term, 1- to 3-day, trajectory of the Nasdaq 100 from a technical analysis perspective.
Nasdaq 100: At Risk of Minor Mean Reversion Decline Below 29,505/615
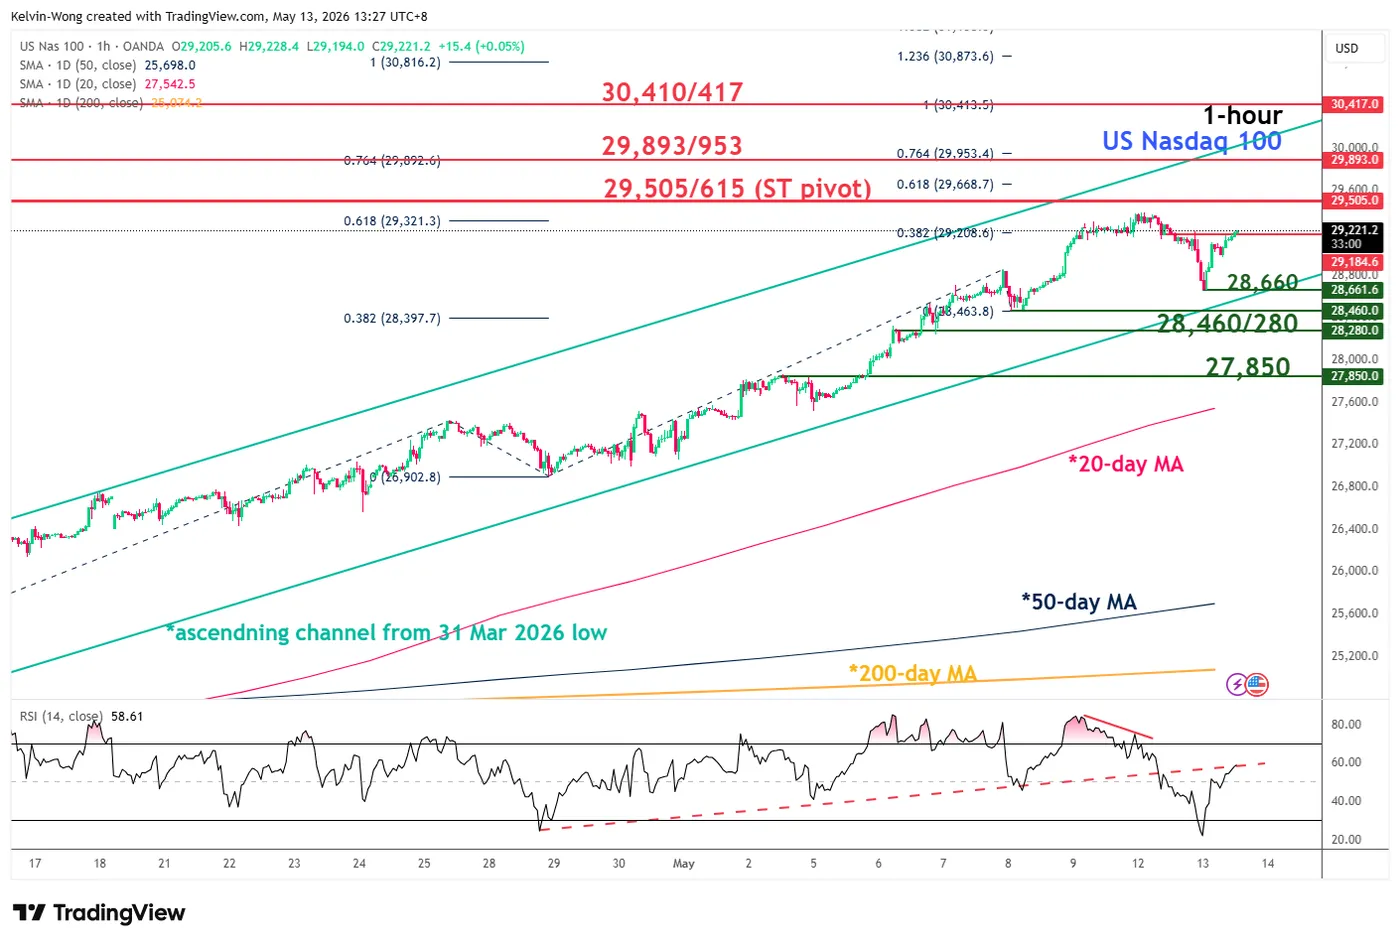
Fig. 3: US Nasdaq 100 CFD index minor trend as of 13 May 2026. Source: TradingView.
Trend bias: Minor corrective decline below 29,505/615 key short-term pivotal resistance within medium-term uptrend.
Supports: 28,660, 28,460/280, and 27,850, close to the 20-day moving average.
Next resistances: 29,893/953 and 30,410/417, Fibonacci extension clusters.
Key Elements Supporting the Near-Term Bearish Bias on the Nasdaq 100
- The current all-time intraday high of 29,390 printed on Monday, 11 May 2026, has moved significantly away from its 20-day moving average by almost 6%.
- The hourly RSI momentum indicator flashed a bearish divergence condition on Monday, 11 May 2026.
- The hourly RSI momentum indicator staged a bearish breakdown below its key ascending support on Tuesday, 12 May 2026.


