
Key Highlights
Bitcoin started a fresh increase above the $107,000 resistance.
- BTC/USD cleared a major bearish trend line with resistance at $106,250 on the 4-hour chart.
- Ethereum is showing positive signs above the $2,600 level.
- XRP price is consolidating and facing hurdles near $2.350.
Bitcoin Price Technical Analysis
Bitcoin price started a fresh increase above the $102,000 zone against the US Dollar. BTC was able to surpass the $105,000 and $106,000 resistance levels.
Looking at the 4-hour chart, the price settled above the $105,000 level, the 100 simple moving average (red, 4-hour), and the 200 simple moving average (green, 4-hour). It even cleared a major bearish trend line with resistance at $106,250.
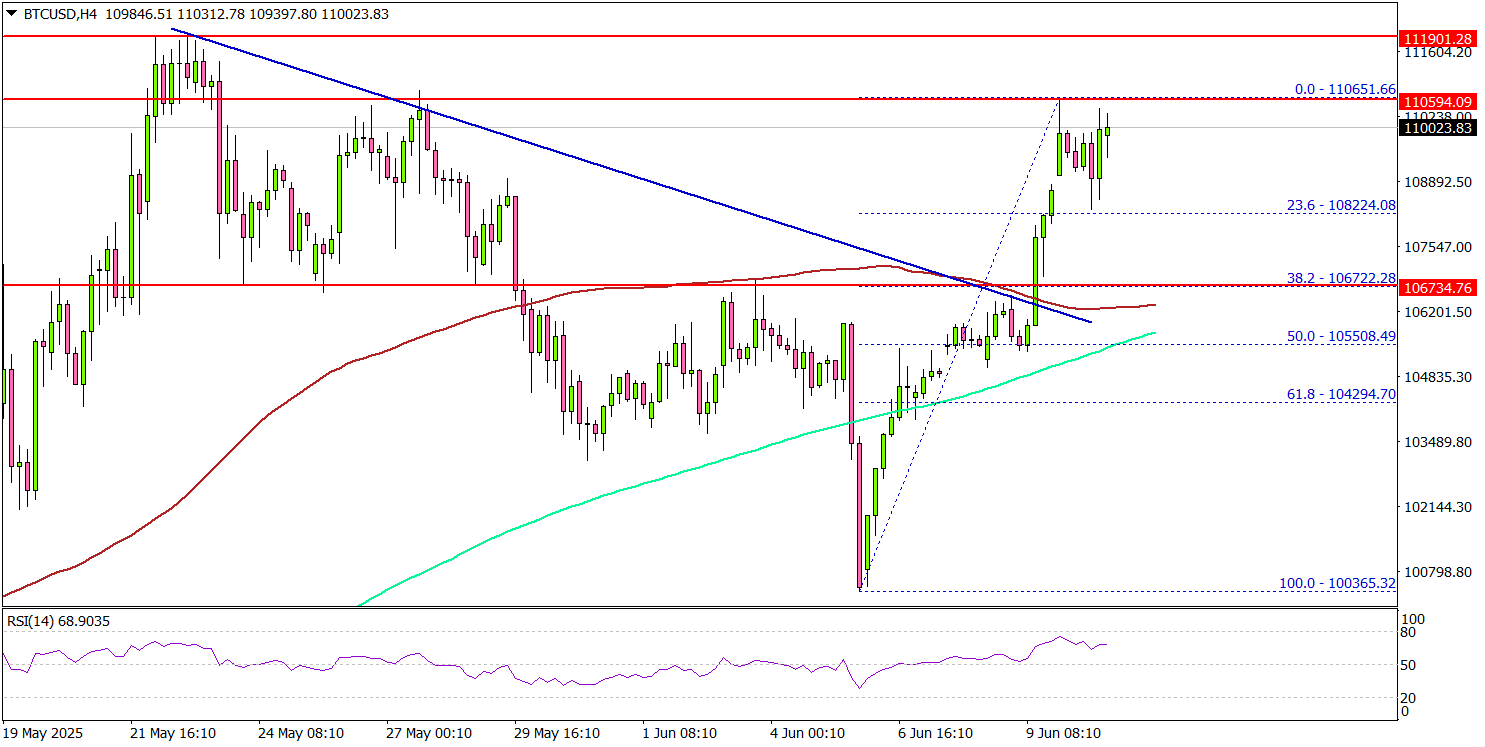
A high was formed at $110,651 and the price is now consolidating gains. Immediate support is near the $108,000 level. The next key support sits at $106,750 or the 38.2% Fib retracement level of the upward move from the $100,365 swing low to the $110,651 high.
A downside break below $106,750 might send Bitcoin toward the $105,500 support. Any more losses might send the price toward the $104,200 support zone.
On the upside, the price could face resistance near the $110,500 level. The next key resistance is $111,900. The main resistance could be $112,500. A successful close above $112,500 might start another steady increase.
In the stated case, the price may perhaps rise toward the $115,000 level. Any more gains might call for a test of $120,000.
Looking at Ethereum, the bulls seem to be in control, and they were able to push the price above the $2,620 resistance zone.
Today’s Economic Releases
- US Consumer Price Index for May 2025 (MoM) – Forecast +0.2%, versus +0.2% previous.
- US Consumer Price Index for May 2025 (YoY) – Forecast +2.5%, versus +2.3% previous.
- US Consumer Price Index Ex Food & Energy for May 2025 (YoY) – Forecast +2.9%, versus +2.8% previous.


