
Key Highlights
- Bitcoin started a fresh increase above the $103,000 resistance.
- BTC/USD is approaching a major bearish trend line with resistance at $107,000 on the 4-hour chart.
- Ethereum recovered losses and climbed above the $2,300 resistance.
- XRP price is consolidating and facing hurdles near $2.250.
Bitcoin Price Technical Analysis
Bitcoin price started a fresh increase above the $102,500 zone against the US Dollar. BTC was able to surpass the $103,000 and $103,500 resistance levels.
Looking at the 4-hour chart, the price settled above the $104,000 level and tested the 100 simple moving average (red, 4-hour). The price surpassed the 61.8% Fib retracement level of the downward move from the $108,978 swing high to the $98,169 low.
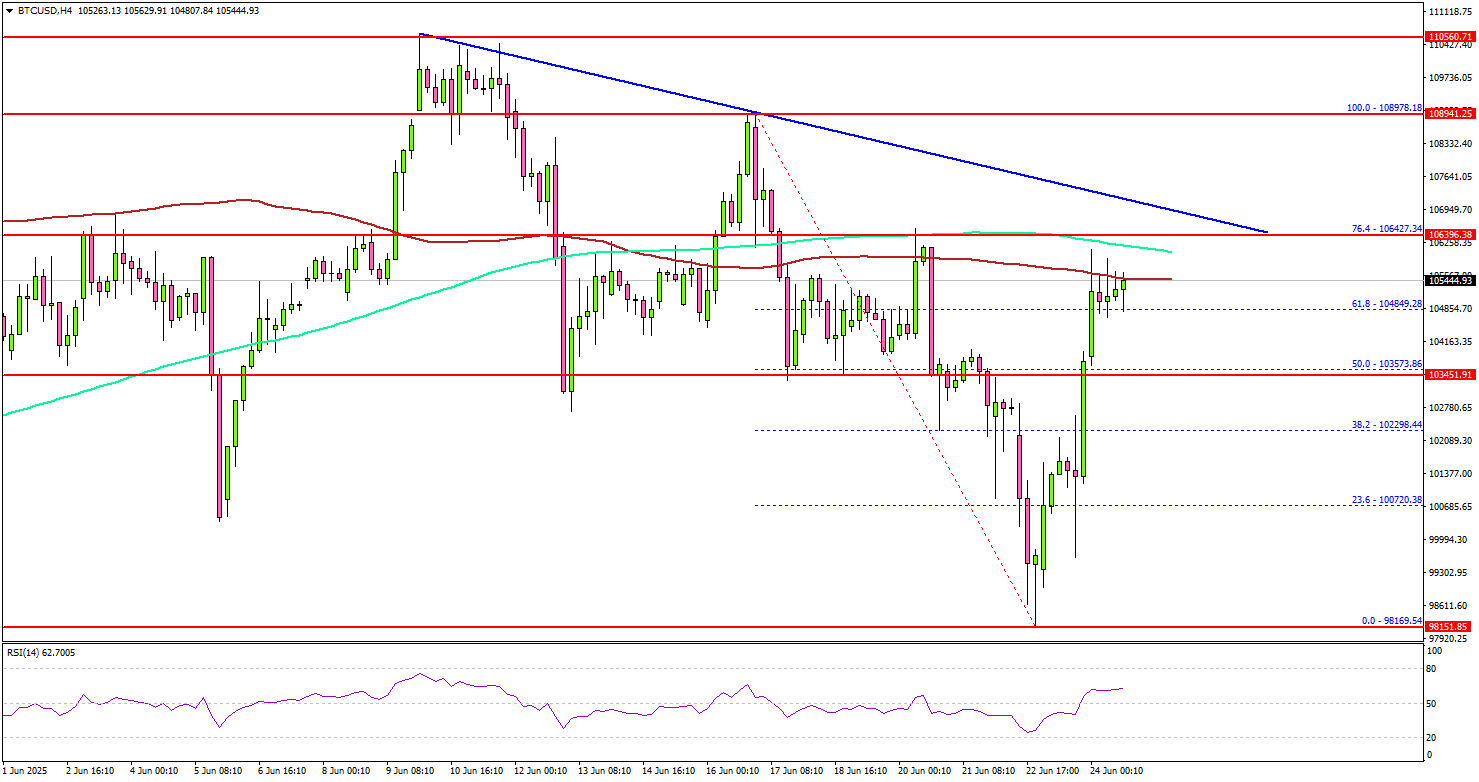
On the upside, the price could face resistance near the $106,500 level or the 76.4% Fib retracement level of the downward move from the $108,978 swing high to the $98,169 low.
The next key resistance is $107,000. There is also a major bearish trend line forming with resistance at $107,000 on the same chart. A successful close above $107,000 might start another steady increase.
In the stated case, the price may perhaps rise toward the $110,000 level. Any more gains might call for a test of $112,000. If there is a pullback, Bitcoin might find support near the $103,500 level.
A downside break below $103,000 might send BTC toward the $101,500 support. Any more losses might send the price toward the $100,000 support zone.
Looking at Ethereum, the bulls seem to be in control, and they were able to push the price above the $2,300 resistance zone.
Today’s Economic Releases
- Fed’s Chair Powell testifies.
- US New Home Sales for May 2025 (MoM) – Forecast 1.5% versus 10.9% previous.


