
Key Highlights
- GBP/USD found support at 1.3140 and started a recovery wave.
- It cleared a connecting bearish trend line with resistance at 1.3280 on the 4-hour chart.
- EUR/USD recovered some losses and climbed above 1.1520.
- Gold prices are moving higher above the $3,375 resistance zone.
GBP/USD Technical Analysis
The British Pound started a fresh decline below the 1.3450 level against the US Dollar. GBP/USD declined below 1.3250 before the bulls appeared.
Looking at the 4-hour chart, the pair tested the 1.3140 level. It settled below the 100 simple moving average (red, 4-hour) and the 200 simple moving average (green, 4-hour).
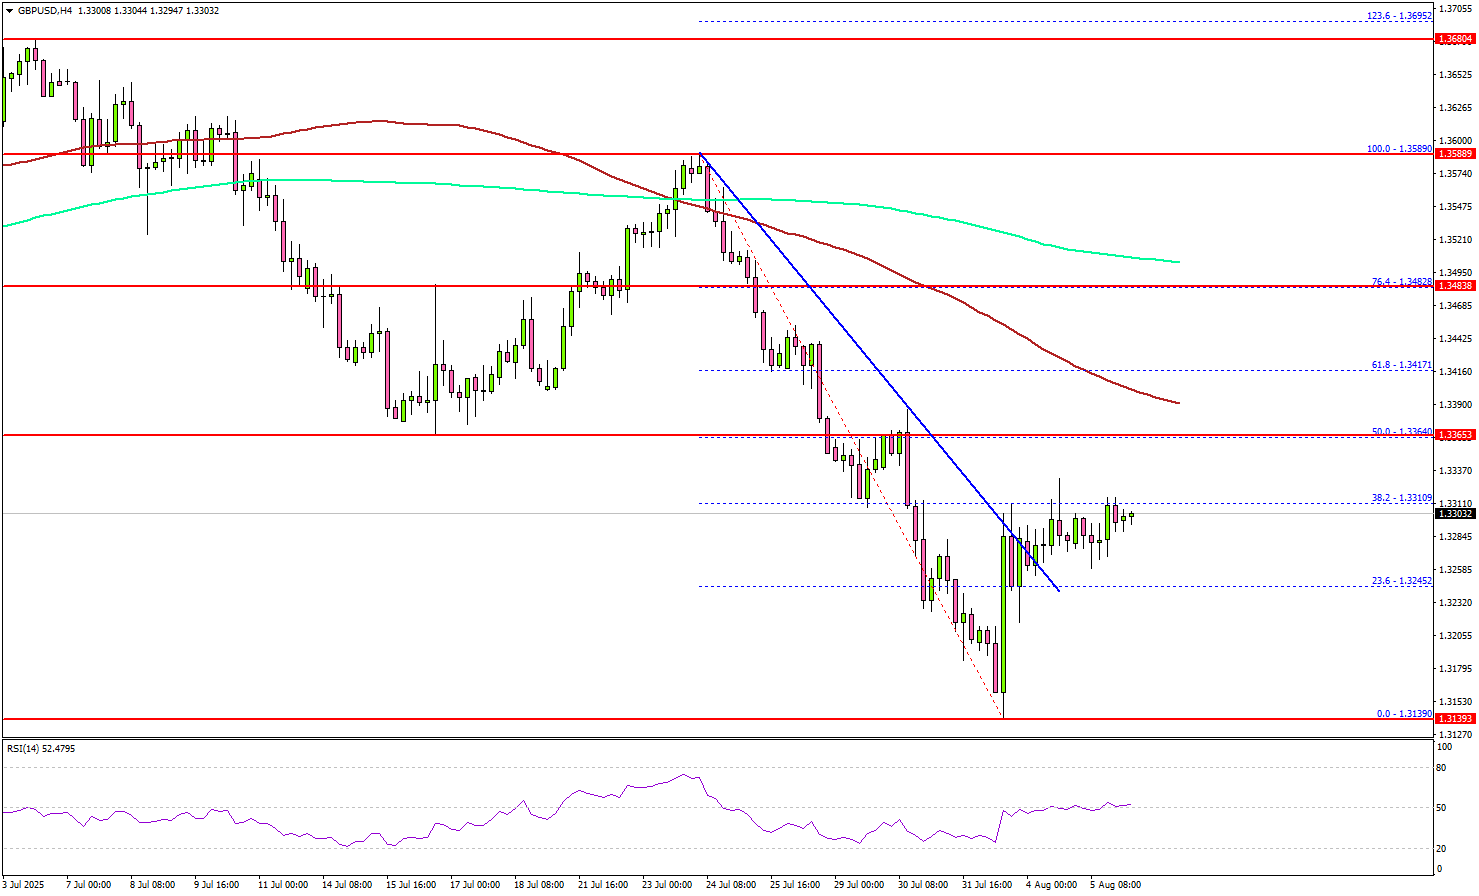
A low was formed at 1.3139 and the pair is now attempting to recover. There was a move above the 1.3250 resistance zone. The pair cleared a connecting bearish trend line with resistance at 1.3280.
Moreover, there was a move above the 23.6% Fib retracement level of the downward move from the 1.3589 swing high to the 1.3139 low. On the upside, the pair now faces resistance near the 1.3320 level. The next key resistance sits near the 1.3400 level and the 100 simple moving average (red, 4-hour).
A close above the 1.3400 level could set the pace for another increase. In the stated case, the pair could rise toward the 1.3480 resistance or the 76.4% Fib retracement level of the downward move from the 1.3589 swing high to the 1.3139 low. The next major stop for the bulls could be near the 1.3550 resistance.
On the downside, immediate support is near the 1.3250 level. The next key support sits near 1.3220. Any more losses could send the pair toward the 1.3150 support zone.
Looking at EUR/USD, the pair started a recovery wave, but the bears might remain active near the 1.1620 resistance zone.
Upcoming Economic Events:
- Fed’s Collins speech.
- Fed’s Cook speech.


