As our members know, we’ve been long in ETHUSD . The crypto has made a nice reaction from our buying zone. In this technical article, we are going to present Elliott Wave trading setup of ETHUSD. The crypto completed its corrective decline precisely at the Equal Legs area, also known as the Blue Box.
In the following sections, we’ll break down the Elliott Wave structure, explain the trading setup, and present target levels.
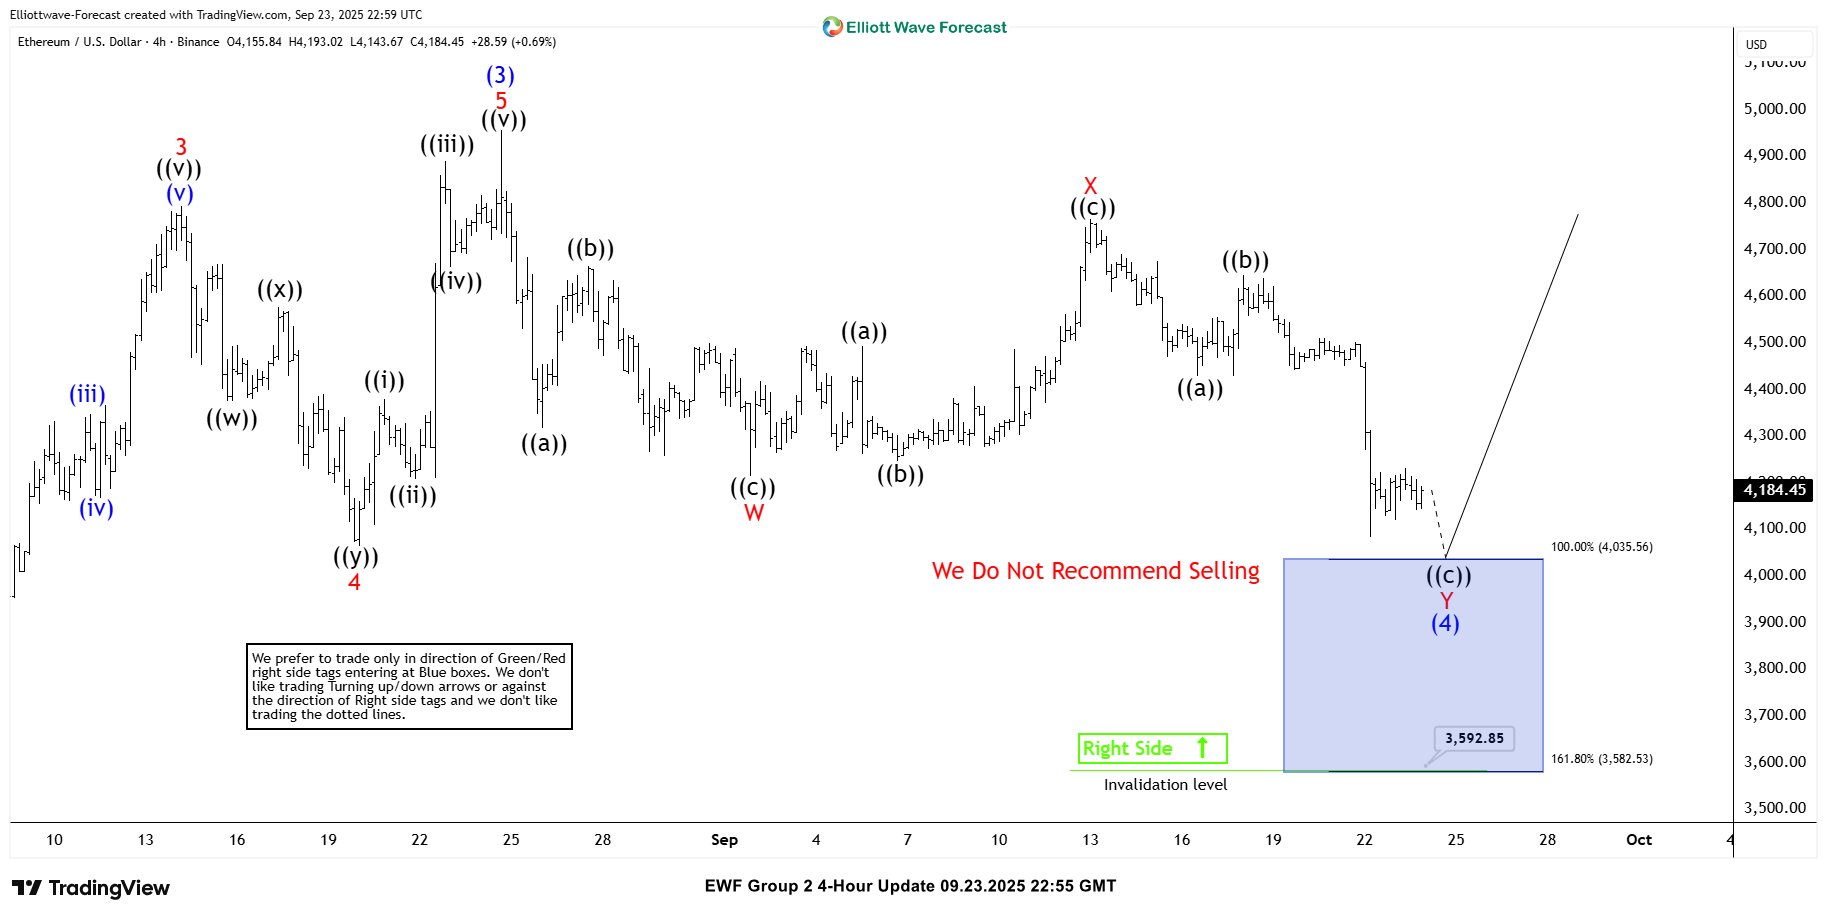
ETHUSD Elliott Wave 4 Hour Chart 09.23.2025
Pullback is unfolding as a Double Three correction. Price is reaching our buying zone at 4,035–3,582 (Blue Box). Since the main trend is still bullish, we expect at least a 3-wave bounce from this area — and ideally, a move toward new highs. We don’t recommend shorting here and prefer the long side from the marked Blue Box. Once price hits the 50% Fibonacci retracement against the X red connector, we’ll move the stop to breakeven and secure some partial profits. A break below the 1.618 extension at 3,582 would invalidate the setup.
Quick reminder on how to trade our charts :
Red bearish stamp+ blue box = Selling Setup
Green bullish stamp+ blue box = Buying Setup
Charts with Black stamps are not tradable. 🚫
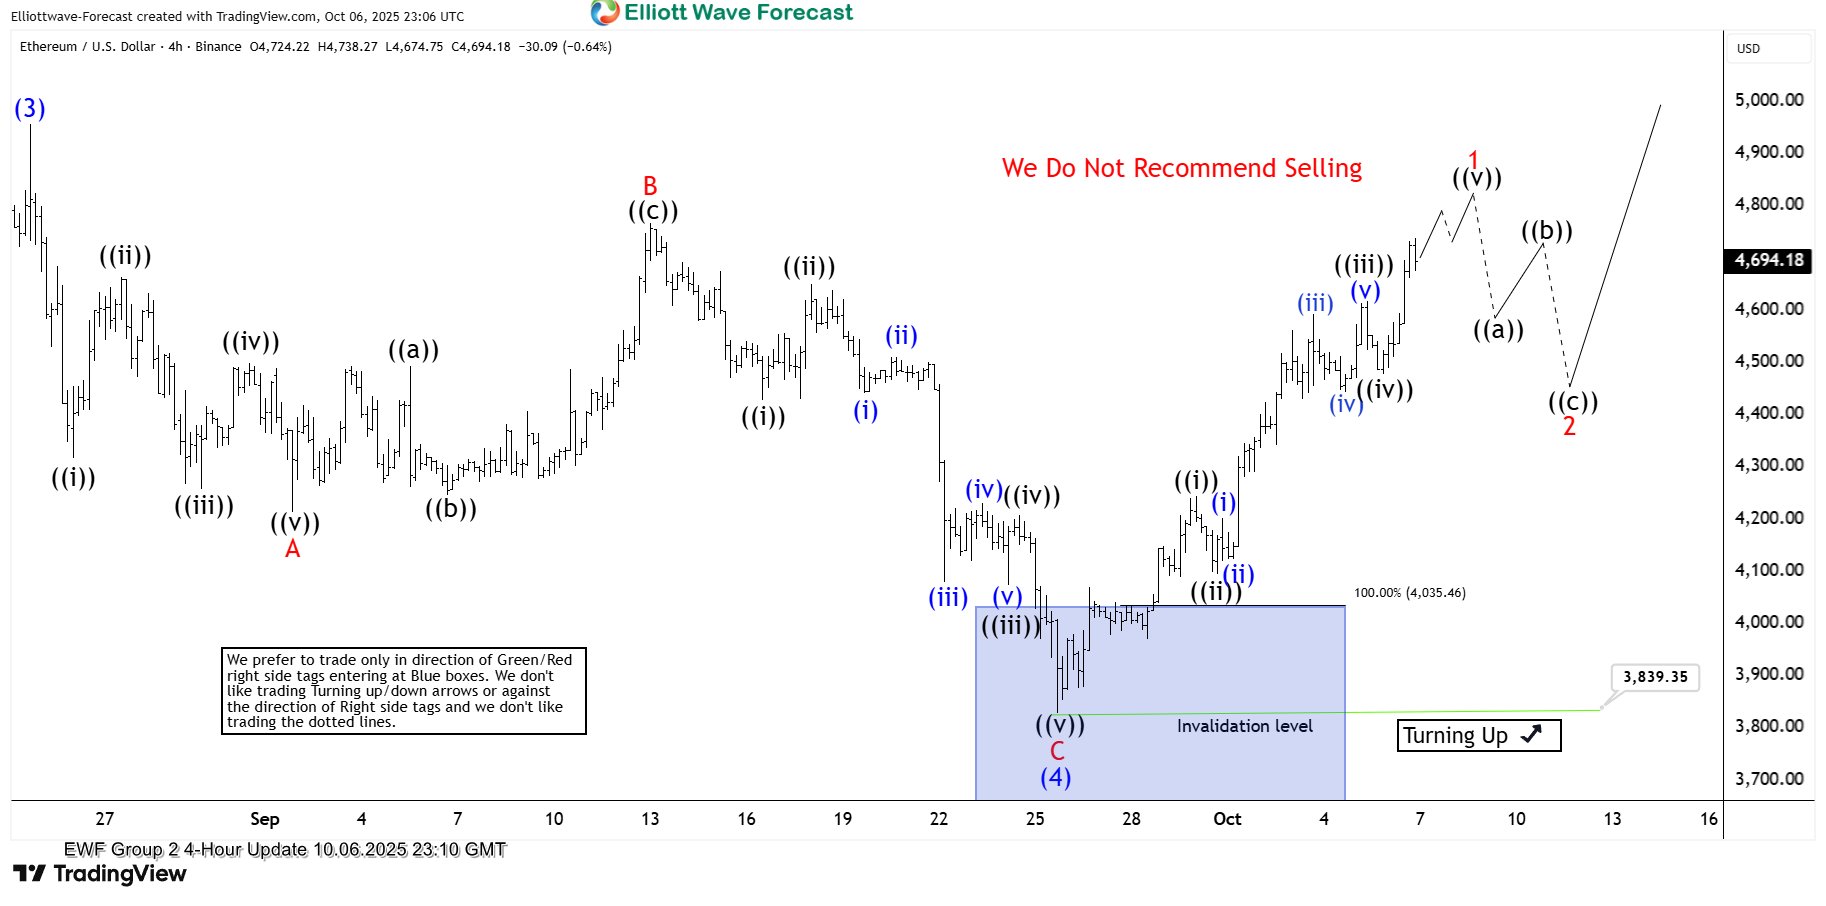
ETHUSD Elliott Wave 4 Hour Chart 10.06.2025
The crypto extended lower into the Blue Box area and found buyers, as expected. The correction ended at the 3,839.35 low, and since then, Ethereum has made a decent rally. As a result, all long positions entered at the Blue Box are now risk-free — we’ve moved our stop loss to breakeven and already secured partial profits. We expect to complete 5 waves from the 3,839.35 low soon and to see a 3-wave pullback before a further rally resumes. As long as the pivot at the mentioned low holds, the crypto is targeting the 5,225.56+ area.