
Key Highlights
- GBP/USD started a recovery wave above the 1.3350 resistance.
- It cleared a key bearish trend line with resistance at 1.3400 on the 4-hour chart.
- EUR/USD recovered above 1.1650 but failed to clear 1.1730.
- Gold is now consolidating gains near the all-time high at $4,350.
GBP/USD Technical Analysis
The British started a recovery wave from 1.3350 against the US Dollar. GBP/USD managed to surpass 1.3380 and 1.3400 before the bears appeared.
Looking at the 4-hour chart, the pair traded above a key bearish trend line with resistance at 1.3400. It tested the 1.3470 level and the 200 simple moving average (green, 4-hour). The bears seem to be active below the 1.3470 level, and the pair is slowly trimming gains.
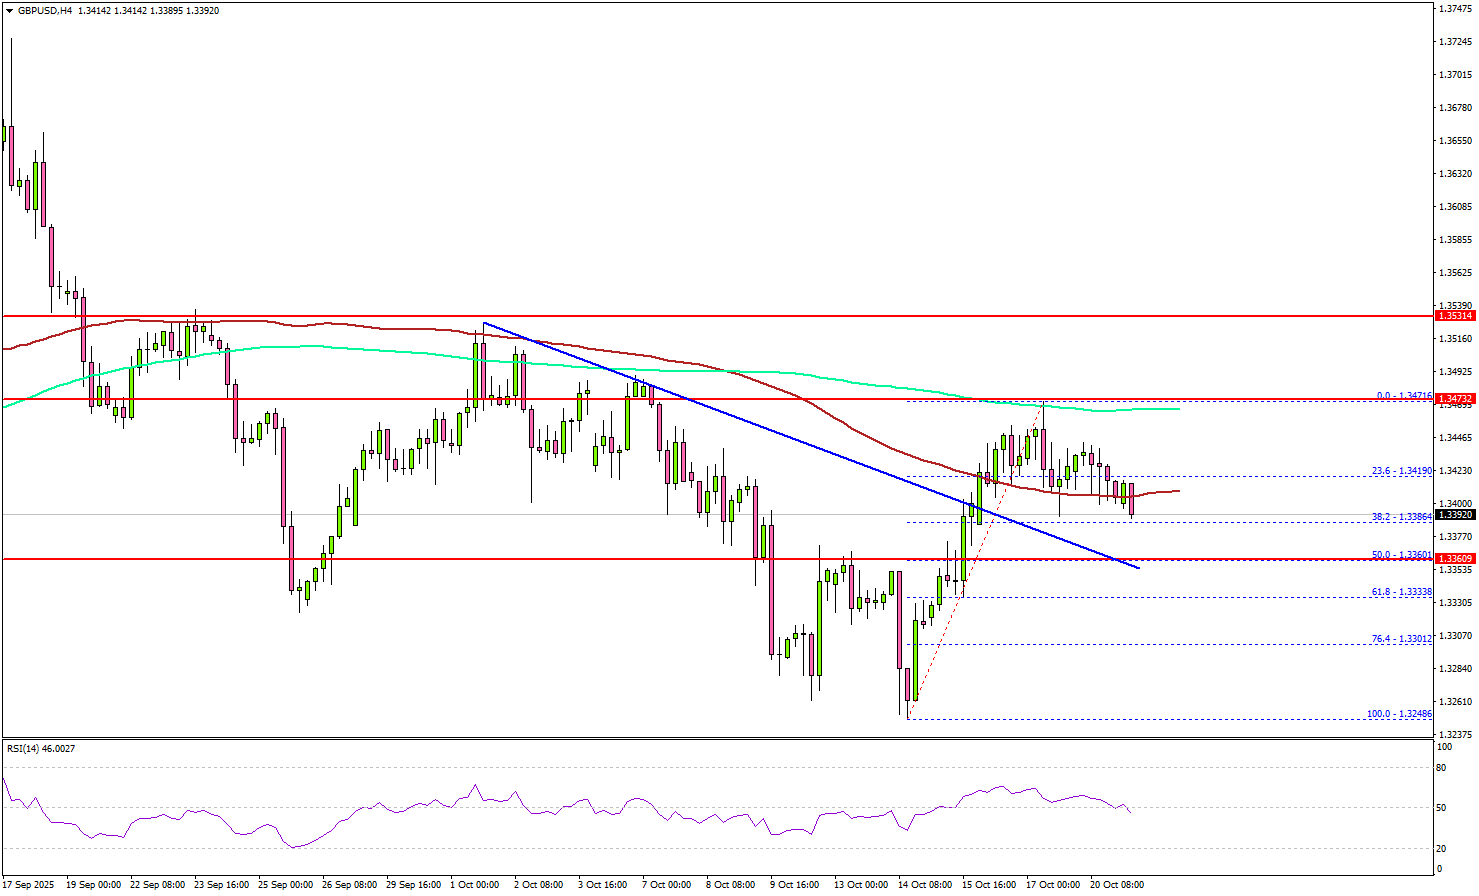
It already dipped below the 23.6% Fib retracement level of the recent increase from the 1.3248 swing low to the 1.3471 high. On the downside, the pair might find support at 1.3380.
The main support might be 1.3360 and the 50% Fib retracement level of the recent increase from the 1.3248 swing low to the 1.3471 high. A close below 1.3360 could start a major pullback toward 1.3300. Any more losses might open the doors for a test of 1.3240.
On the upside, the pair faces resistance near the 1.3470 level and the 200 simple moving average (green, 4-hour). The next hurdle could be near 1.3500. A close above 1.3500 resistance might push the pair to 1.3550.
Looking at EUR/USD, the pair started a recovery wave, but the bears might remain active near the 1.1720 and 1.1730 levels.
Upcoming Key Economic Events:
- ECB’s President Lagarde speech.
- Fed’s Waller speech.


