
Key takeaways
- Gold’s sharp correction: XAU/USD plunged over 8% from its all-time high of US$4,381, marking its steepest drop since August 2020.
- Short-term bullish reversal signs: Technical indicators, including bullish “Hammer” candlestick formations and RSI divergence, signal potential rebound momentum.
- Medium-term uptrend intact: Gold remains supported by a sustained downtrend in the 10-year US Treasury real yield below 1.87%.
- Key levels to watch: Support sits at US$4,056/4,000; resistance zones at US$4,267, US$4,380, and US$4,424/4,455.
Gold (XAU/USD) has experienced a volatile movement in the past three sessions. The precious yellow metal has managed to reverse the 1.7% loss it incurred last Friday, 17 October 2025, and rallied by 2.4% on Monday, 22 October 2025, to print a fresh record high of US$4,381.
Thereafter, gold (XAU/USD) recorded a swift decline on Tuesday, 21 October 2025, where it tumbled by 6.3% on an intraday basis, but it pared back some losses to close at US$4,125 with a daily loss of -5.3%, still a significant occurrence as yesterday’s loss was the worst since August 2020.
Yesterday’s swift decline is likely due to stop-losses triggered on short-term leveraged long positions on gold (XAU/USD), where it has gained “attraction” after the bullish breakout triggered on 29 August 2025 from the prior 4-month of “Ascending Triangle” range configuration that led to a steep bullish impulsive up move sequences in the recent two months.
Interestingly, longer-term technical elements and one key macro factor are still suggesting that the medium-term and major uptrend phases of gold (XAU/USD) remain intact.
A lower long-term US real interest rate acts as a tailwind for gold
10-year US Treasury real yield remains in a medium-term downtrend
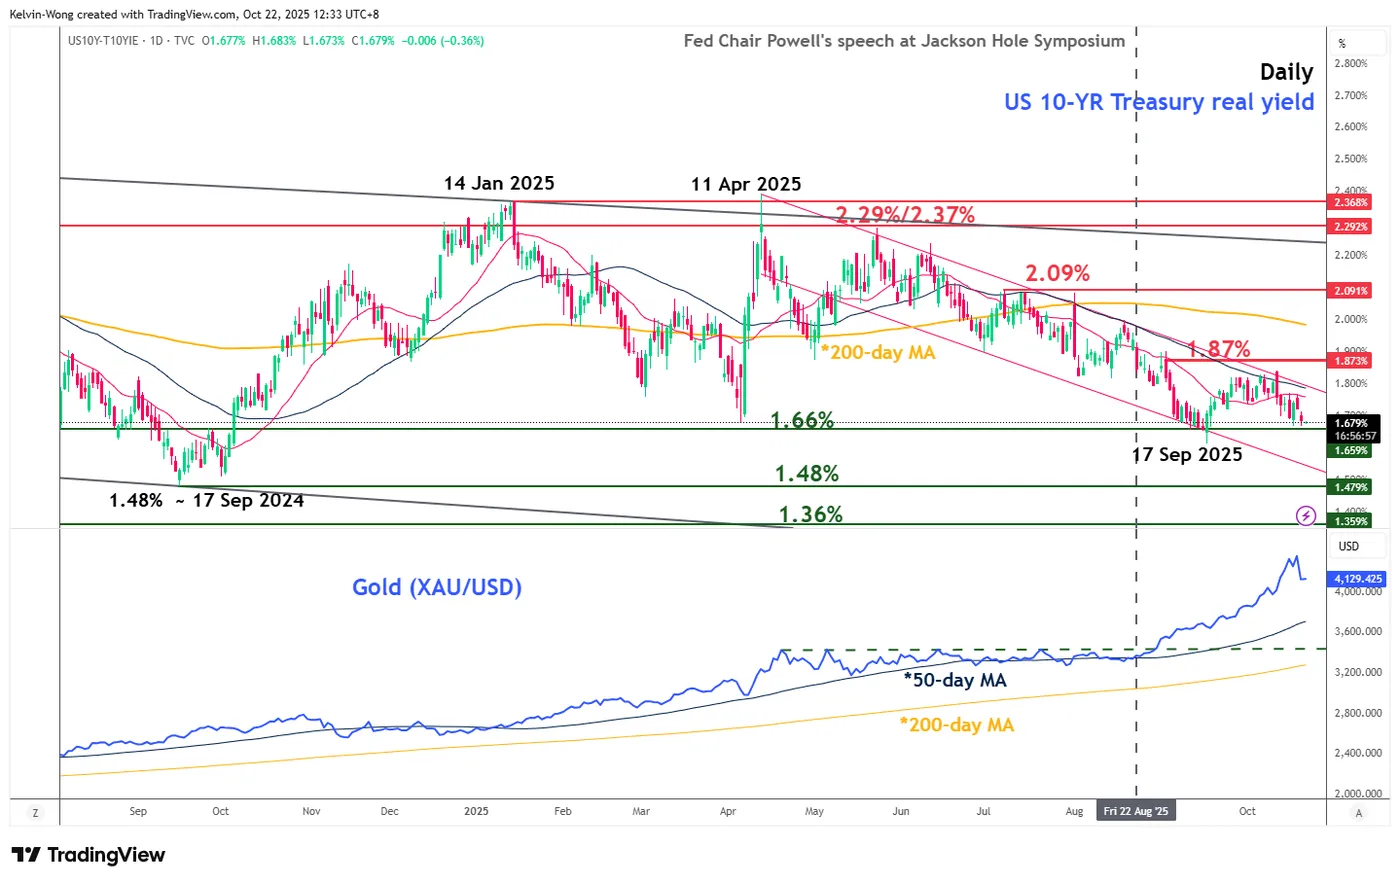
Fig. 1: 10-year US Treasury real yield with Gold (XAU/USD) medium-term & major trends as of 22 Oct 2025 (Source: TradingView)
The 10-year US Treasury real yield (excluding 10-year breakeven inflation rate) medium-term downtrend remains intact as it remained below its 50-day moving average and 1.87% key medium-term resistance (see Fig. 1).
Based on intermarket analysis, a cap on any further rebound in the 10-year US Treasury real yield below 1.87% and a break below 1.66% key intermediate support reduces the opportunity costs of holding gold (XAU/USD) as it is a non-income-bearing asset, in turn, creating a further positive feedback loop back into the price actions of gold (XAU/USD).
Interestingly, the prior decline in the 10-year US Treasury real yield from 2.05% on 1 August 2025 to 1.79% on 28 August 2025 coincided with gold (XAU/USD)’s bullish breakout from its former 4-month “Ascending Triangle” range configuration in place since April 2025.
Let’s now examine the latest short-term trajectory (1 to 3 days), relevant key elements, and key levels to watch for Gold (XAU/USD) from a technical analysis perspective
Preferred trend bias (1-3 days) – Bullish reversal at US$4,056/4,000 key support
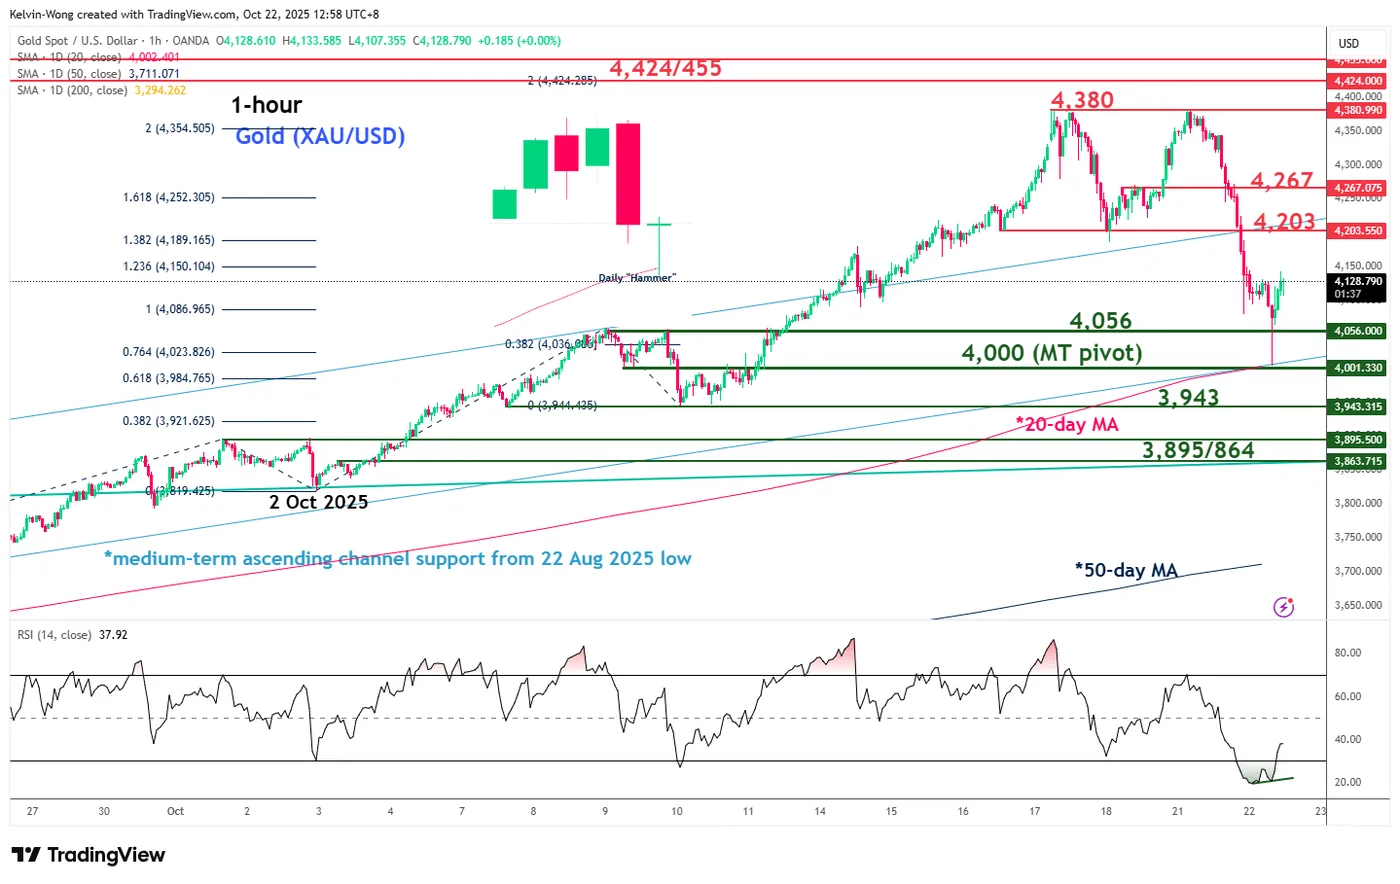
Fig. 2: Gold (XAU/USD) minor trend as of 22 Oct 2025 (Source: TradingView)
Watch the US$4,056/4,000 key medium-term pivotal support, and a clearance above US$4,203 is likely for the bullish reversal scenario to gain traction for the next intermediate resistances to come in at US$4,267, US$4,380 (current all-time high area), and US$4,424/4,455 (see Fig. 2).
Key elements
- Gold (XAU/USD) has staged a swift decline of 8.6% from its current all-time high of US$4,381 printed on Monday, 20 October 2025, to a current intraday low of US$4,004 on Wednesday, 22 October 2025, at the time of writing.
- The 8% plus rapid decline in the price actions of gold (XAU/USD) has led the hourly RSI momentum indicator of gold to hit an extreme oversold level of 19.61on Wednesday, 22 October 2025, and subsequently, flashed out a bullish divergence condition.
- The price action of Gold (XAU/USD) has formed an hourly bullish “Hammer” candlestick in today’s Asia session, right after a retest of its rising 20-day moving average. Also, it has formed an impending daily “Hammer” candlestick. These observations suggest a potential capitulation of bearish momentum.
Alternative trend bias (1 to 3 days)
Failure to hold at the US$4,056/4,000 key medium-term support invalidates the bullish reversal scenario for gold (XAU/USD), where a medium-term (multi-week) corrective decline may unfold to expose the next intermediate supports at US$3,943 and US$3,895/3,864


