
Amid the absence of key US labor data during the longest US government shutdown in history (which has undoubtedly started to weigh on market sentiment, look at stocks this week!), the northern neighbor Canada was still able to deliver a surprise to traders.
The Canadian labor market delivered a second consecutive beat in employment growth, reporting an actual gain of 66.6K jobs (exp -2.5K).
This unexpected surge provides a much-needed lift.: while Canada has been struggling with tariffs biting into some of its key sectors, notably metals and lumber, this comeback in employment marks some slow but tangible regaining of confidence from businesses after what was a rough summer.
However, a closer look reveals that most of these jobs added have been part-time positions.
While this headline beat provided an immediate and strong boost to the Canadian Dollar (CAD), the key question remains whether the market can hold today’s current strength without a corresponding increase in full-time employment.
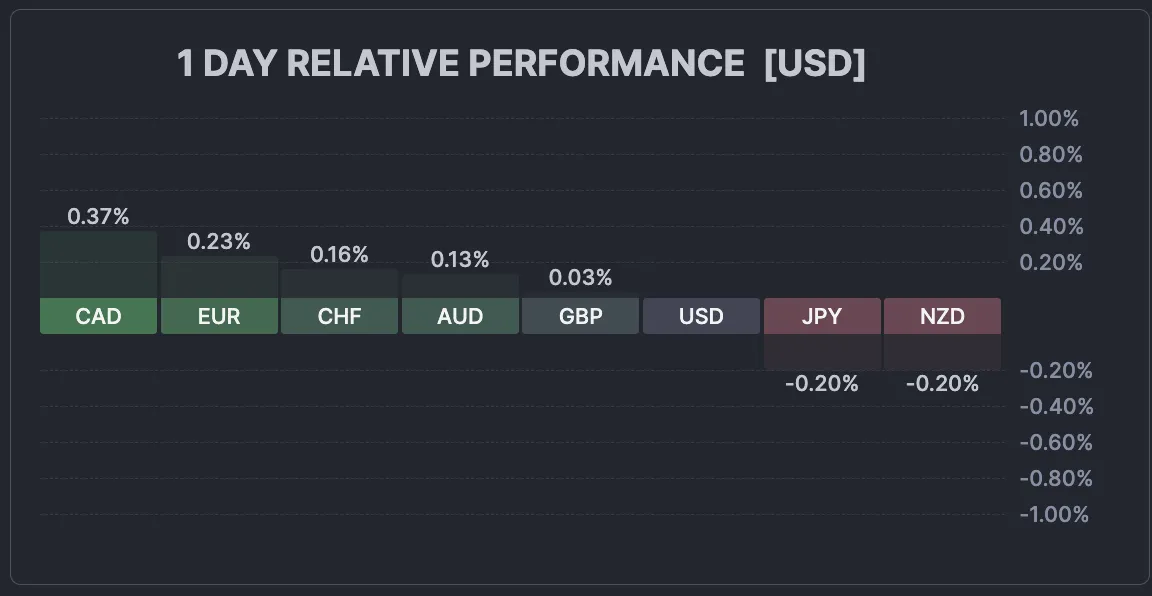
The Canadian Dollar takes the lead on the FX space – November 7, 2025 – Source: Finviz
This is at least a more positive report which may just be the light at the end of the tunnel for the land of Maple Syrup.
Let’s now take a look at multi-timeframe charts for USD/CAD to see where this fundamental surprise could take the pair.
USD/CAD multi-timeframe technical analysis
Daily Chart
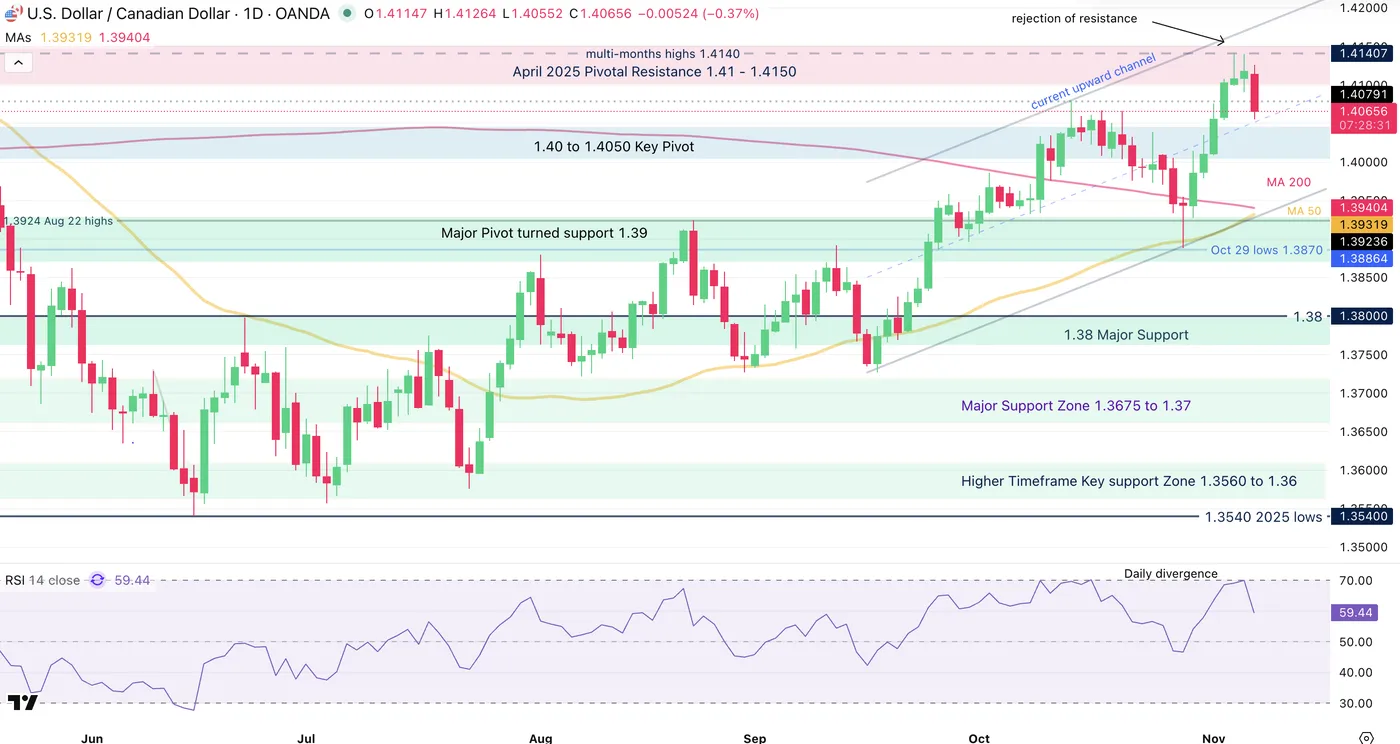
USD/CAD Daily Chart, November 7, 2025 – Source: TradingView
Today’s candle marks the first red candle in the North American pair in 7 sessions.
Some slowing down in buying had brought a double-top RSI divergence which is now seeing some consequences.
The Canadian Dollar has been bleeding for a while with the latest turmoil in US-Canada trade talks – For now, price action remains above the Daily pivot region (1.40 to 1.4050).
4H Chart and levels
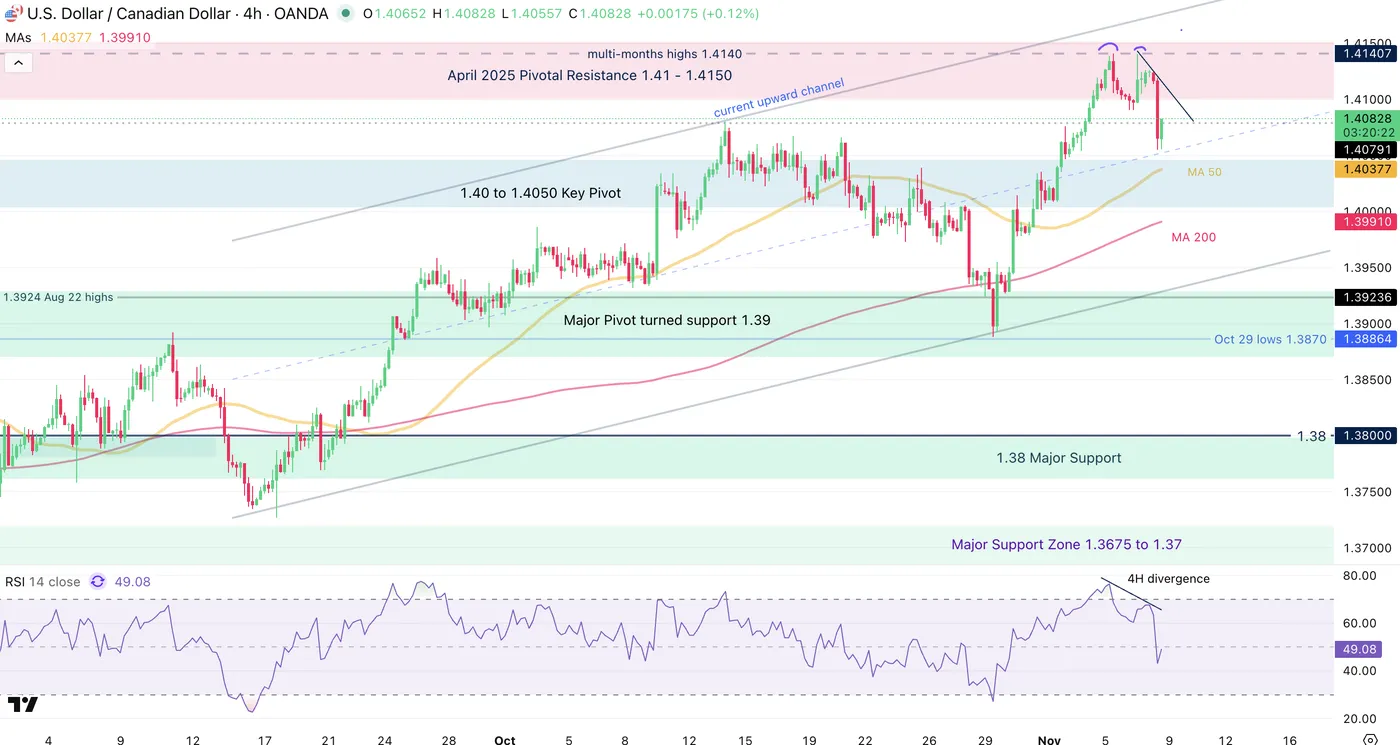
USD/CAD 4H Chart, November 7, 2025 – Source: TradingView
Levels to place on your USD/CAD charts:
Resistance Levels
- April 2025 Pivotal Resistance 1.41 – 1.4150
- Nov 5 weekly and multi-month highs 1.4140
- Key resistance 1.4250
Support Levels
- 1.40 to 1.4050 Key Pivot (4H MA 50)
- Major Daily Pivot 1.39 (+/- 200 pips)
- 1.38 Major support +/- 150 pips
- 1.3550 Main 2025 Support
1H Chart
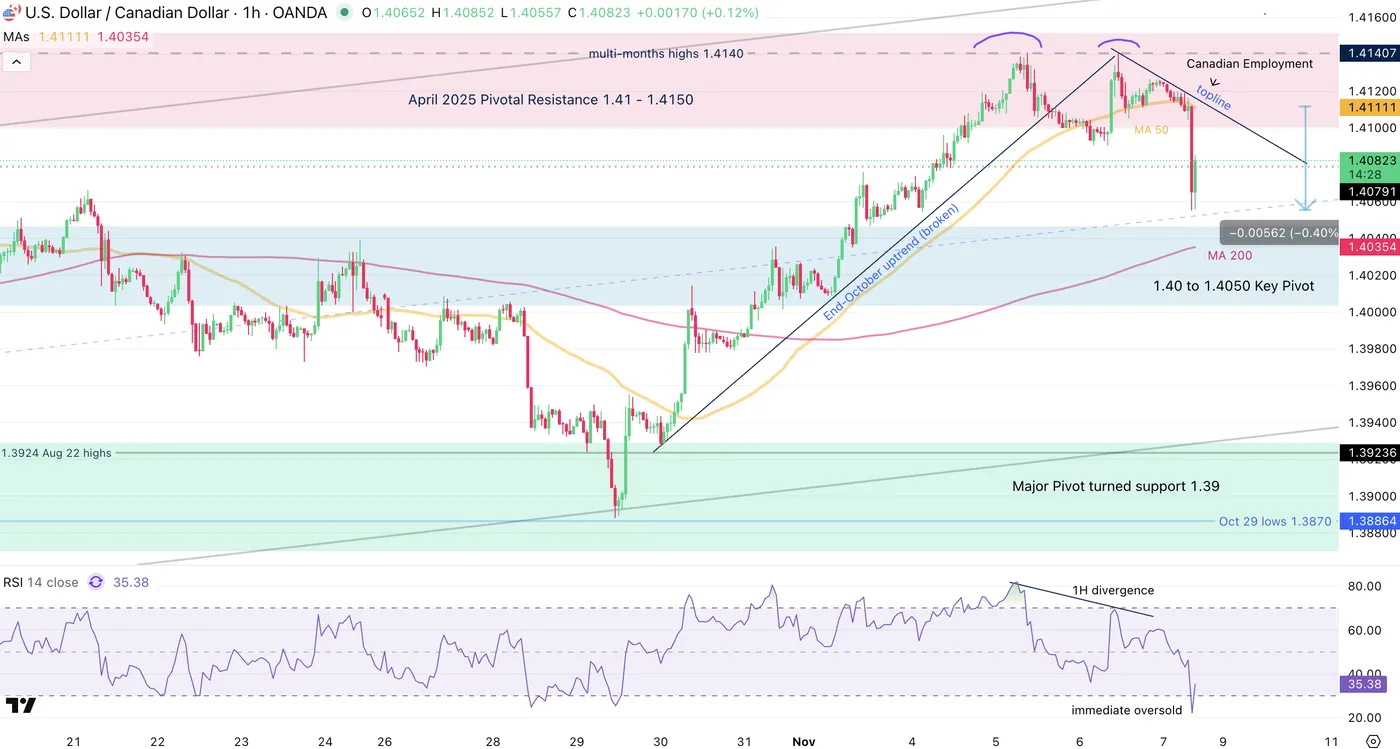
USD/CAD 1H Chart, November 7, 2025 – Source: TradingView
Looking even closer, the divergence happened on all timeframes which magnified this morning’s 600 pip move in the pair.
Oversold RSI on the short timeframe prompts small mean-reversion, but as markets head into the weekly close, check if buyers manage to close the week above 1.41.
Failing to do so adds more probabilities of a short-term reversal within the upward channel (upper bound recently tested)
While the market awaits more developments on trade deals, the main aspects to watch for USD/CAD are:
- Is confidence coming back for Canadian businesses? Look at upcoming Canadian PMI data and retails sales; Stronger data there could support CAD strength
- Is the US Dollar still on its run higher or has it found a local top?
- The usual rate differential: A more hawkish Fed boosted the US Dollar. Look out for Federal Reserve speeches
Safe Trades!


, the northern neighbor Canada was still able to deliver a surprise to traders.)