
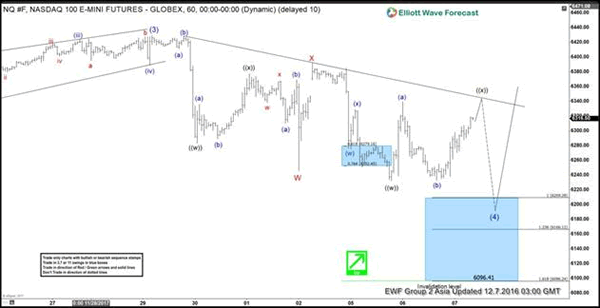
Nasdaq Intraday Elliott Wave view suggests that rally to 6429.5 ended Intermediate wave (3). Intermediate wave (4) pullback is currently in progress to correct cycle from 8/21 low (5753.6) in 3, 7, or 11 swing before the rally resumes. Subdivision of Intermediate wave (4) is unfolding as a double three Elliott wave structure where Minor wave W ended at 6246 and Minor wave X ended at 6391.75. Minor wave Y of (4) is still missing the 100% area at 6096.24 – 6209.28, thus another leg lower still can’t be ruled out. Index should then resume the rally higher or bounce in 3 waves at least.
We don’t like selling the proposed pullback and expect buyers to appear from the above area for at least a 3 waves bounce provided that pivot at 8/21 low (5753.6) stays intact. Alternatively, cycle from 11/29 peak has ended at 6231.75 low and in this case the Index is already in the process of correcting the decline from 11/29 in a larger 3 waves at least.
NQ_F Nasdaq 1 Hour Elliott Wave Chart


