
After an initial inverse reaction—rising at the weekly open following the capture of Venezuela’s Nicolas Maduro—WTI oil prices are now correcting.
The initial spike was fascinating, offering a potential blueprint for what we might expect in the event of a future Russia-Ukraine peace agreement. But why did oil go up on news that logically opens the door to more supply?
It is the effect of an inverted “Buy the Rumor, Sell the News.”
Sanctioned nations like Russia and Venezuela have been forced to supply the market at deep discounts—recently reported as much as $20 below spot prices—to bypass restrictions.
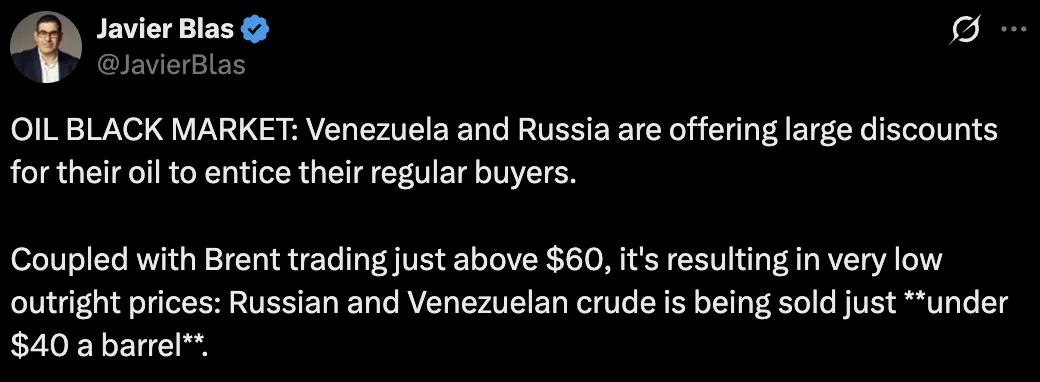
Discounts in the Oil Market – X Post from Javier Blas
When such nations regain official access to traditional markets, their competitive black market offers disappear.
This effectively removes the “cheapest” barrels from the shadow market, creating a temporary perception of tightening or, at the very least, a volatility premium. – This argument is on the backline of why Oil has been going down ever since the beginning of the Ukraine-Russia conflict and could reverse at the resolution.
The same logic applies to Iran, which is currently undergoing what resembles the beginning of a revolution.
The anti-West axis (Iran, Venezuela, Russia) has historically created a drag on oil prices by flooding the market to fund their regimes, even with restricted access. This is the “Sanctions Paradox,” which I gladly invite you all to read more about.
In any case, the test of $59 was short-lived.
Sellers came right back into action to mean-revert the rebound. While higher supply from a reopened Venezuela will eventually offer stiff competition to Canadian heavy crude, this infrastructure ramp-up will take time to materialize.
Consequently, the current pullback is likely explained by the dissipation of that initial geopolitical volatility premium.
But do sellers have enough momentum to push prices to fresh lows? It’s possible, but there are structural elements pointing against it.
Let’s dive right into a multi-timeframe analysis of WTI Oil to see why.
US Oil Intraday Timeframe Analysis
WTI 4H Chart and Technical Levels
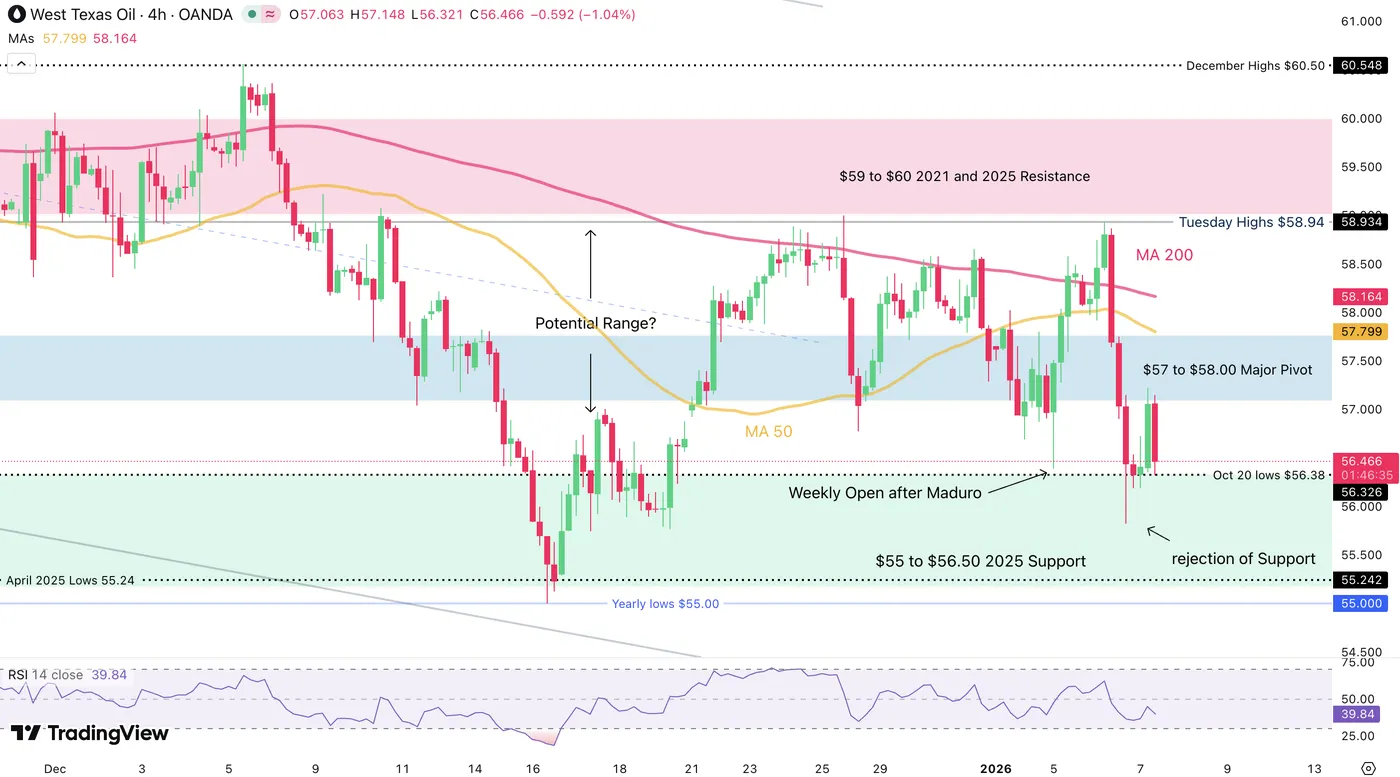
WTI Oil 4H Chart – January 7, 2026. Source: TradingView
Looking at the ongoing price action, the swift selloff has seen mean-reversion buying at the $56.50 Support.
When price action sees such sudden up and down reversals, it tends to offer strong rangebound setups for buy low, sell high setups.
Still, retesting and breaking today’s lows at $55.82 would reject this hypothesis.
When traders are lost and looking for direction, ranges have high chance of forming. This takes even more ground when Moving Averages are flattening like on this chart.
Look for buying at support ($56.40 to $56.50) and profit-taking/selling between $58 to $59.
WTI Technical Levels
Levels to place on your WTI charts:
Resistance Levels
- $57 to $58.00 Major Pivot
- $58.17 4H 200-MA
- $59 to $60 2021 Resistance and Channel Highs
- Minor Resistance $62 to $63
- Key September Resistance $65 to $66
Support Levels
- $56.38 Weekly Open gap down
- $55.83 Session Lows
- $55 to $56.50 2025 Support and Channel lows
- 2019 mini support $53 to $54
- Mid-2019 Main support $51 to $52.50
30M Chart and Trading Setups
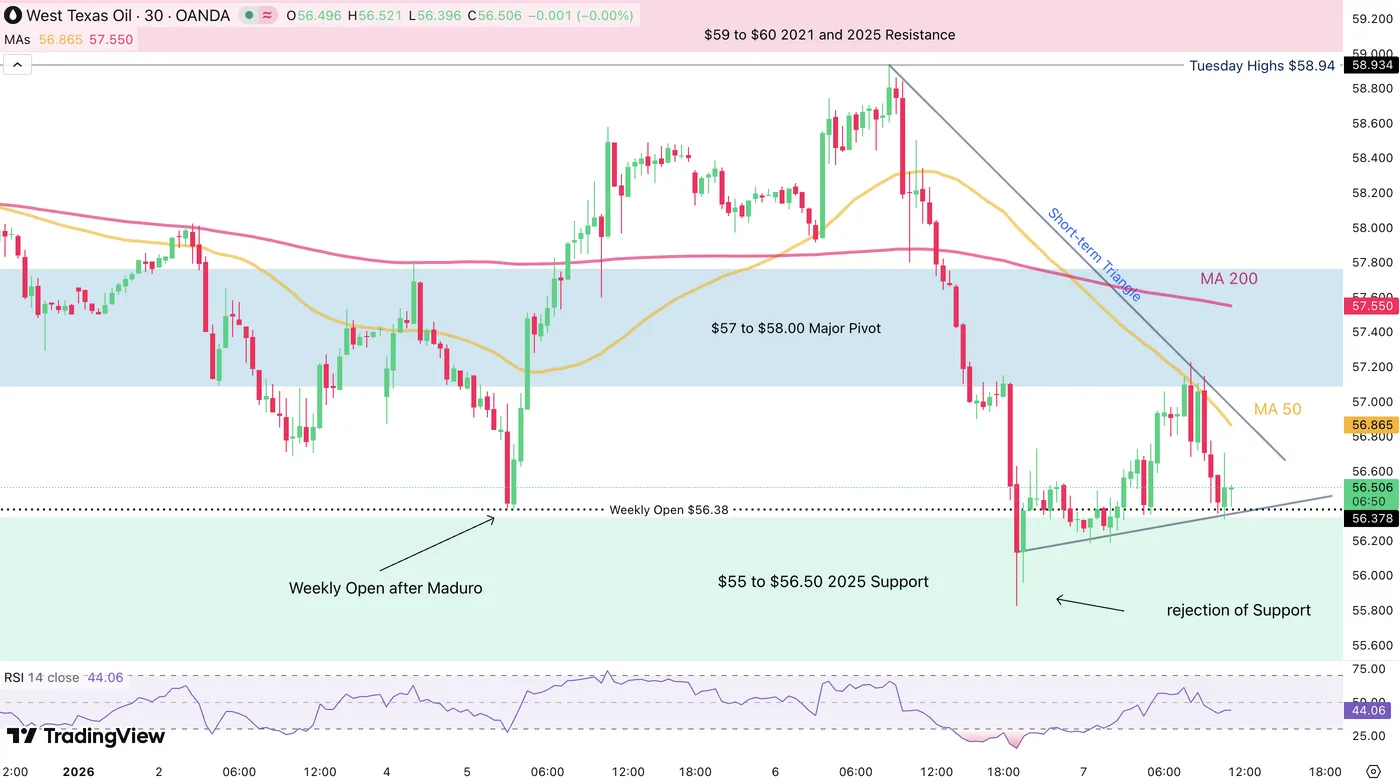
WTI Oil 30M Chart – January 7, 2026. Source: TradingView
After the bouts of volatility from this morning, the action is calming down on shorter timeframes.
Sellers are seeing some exhaustion at the session lows (coinciding with the 2025 lows support) – Still, the buying is timid and seeing rejection at the 30M 50-period MA.
For the rangebound setup, traders can look at a break above the 50 MA to get confirmation with a potential stop below the session lows or 2025 lows for more conservative positions.
Safe Trades and a Successful 2026!