
 and Silver (XAG/USD) to see where these flows could be heading.)
Donald Trump is a stubborn President, to say the least. Just when markets were enjoying a few relaxing months of silence regarding Fed independence, the Administration has struck again.
Over the weekend, the Department of Justice opened a formal investigation into Federal Reserve Chair Jerome Powell, regarding statements made during his recent Senate Testimony.
It is painfully easy to read between the lines here. This appears to be a political masquerade—a manufactured pretext to fire Powell before his term officially concludes.
The impatience seems unjustified, given that his tenure ends in May 2026 and markets are already expecting an announcement on his successor by the end of this month.
In a special address delivered yesterday evening, Chair Powell fired back, significantly upping his tone regarding the Federal Reserve’s stance against politicized interference.
The Verdict: Market Chaos.
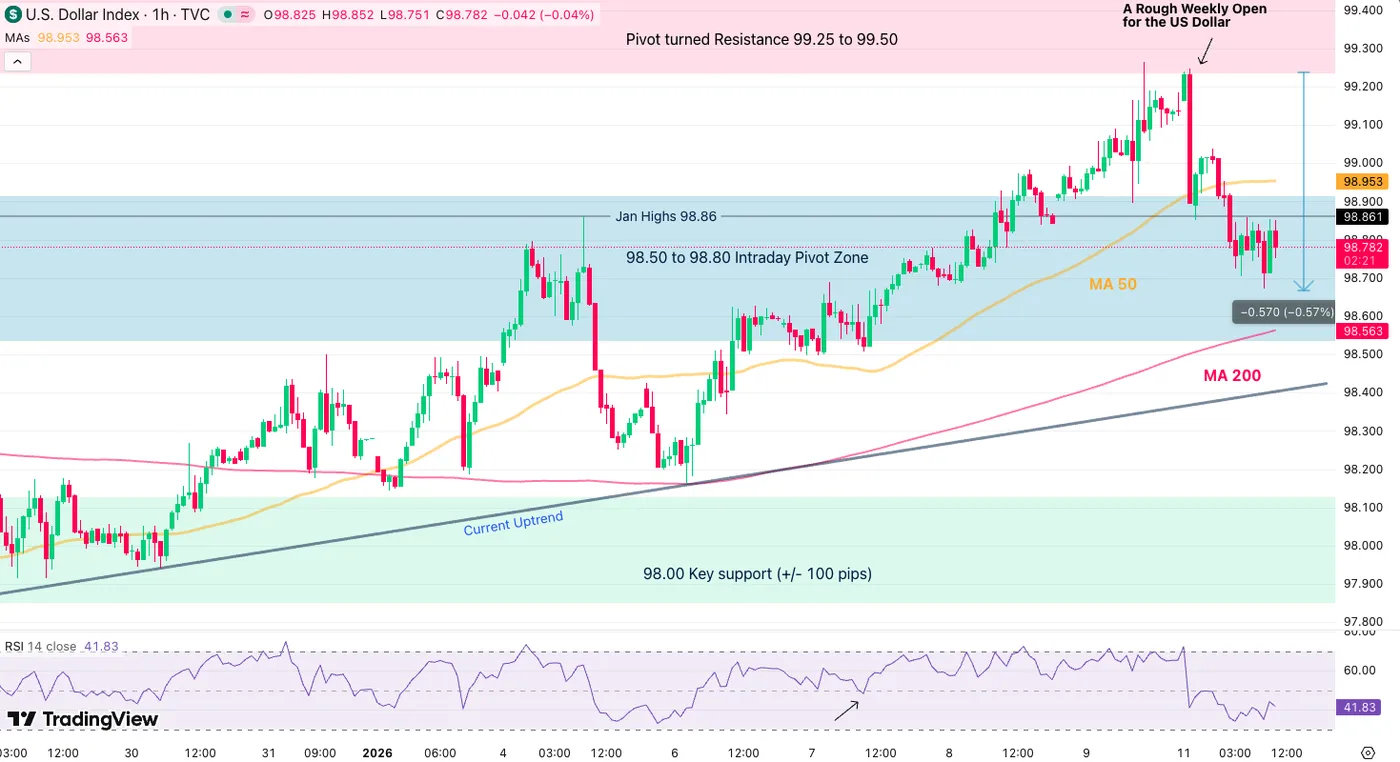
Dollar Index 1H Chart. January 12, 2026 – Source: TradingView
The US Dollar is plummeting to start the week and stocks are in the red. On the other hand, keeping with the dominant trend of the past year, Metals are shining bright.
Acting as the preferred safe haven—displacing even the Yen and the now-compromised US Treasuries—precious metals have shot through the roof in early trading.
This political theater highlights a structural shift: Central Banks and investors are aggressively diversifying away from an overdependence on US assets as their traditionally stable reputation erodes.
Gold has now solidified its place as the largest reserve asset for central banks, with China leading a global diversification charge.
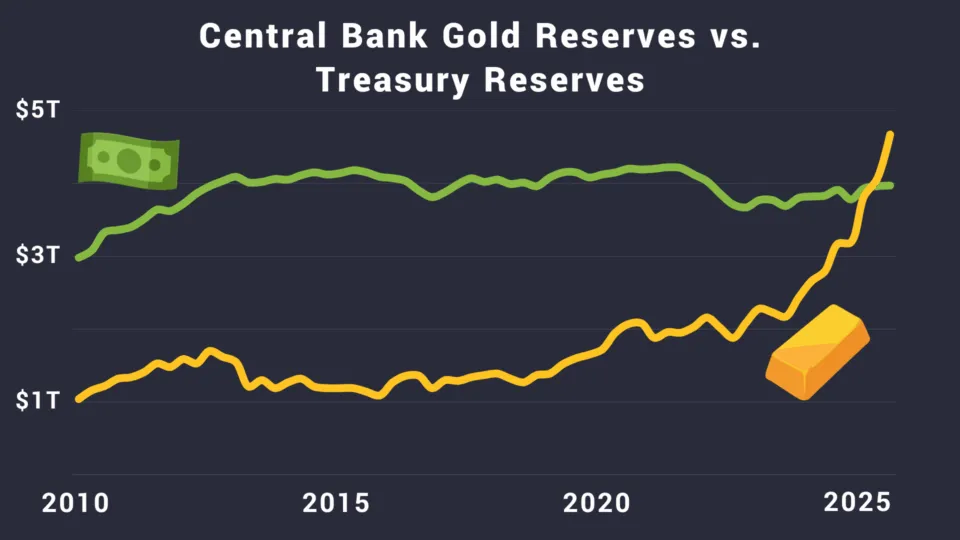
Gold and US Dollar as Central Bank Reserves – Courtesy of Vaulted.com
With Silver breaking $85 and Gold comfortably trading above its previous peak ($4,600+), the message is clear: Metals are not looking to ease their rally anytime soon.
The buying frenzy is broad-based, with Platinum, Palladium, Copper, and Aluminum all chasing new monthly or yearly highs as we speak.
Let’s dive right into a two-timeframe intraday analysis for Gold (XAU/USD) and Silver (XAG/USD) to see where these flows could be heading.
Gold (XAU/USD) Daily and 2H Charts
Daily Chart
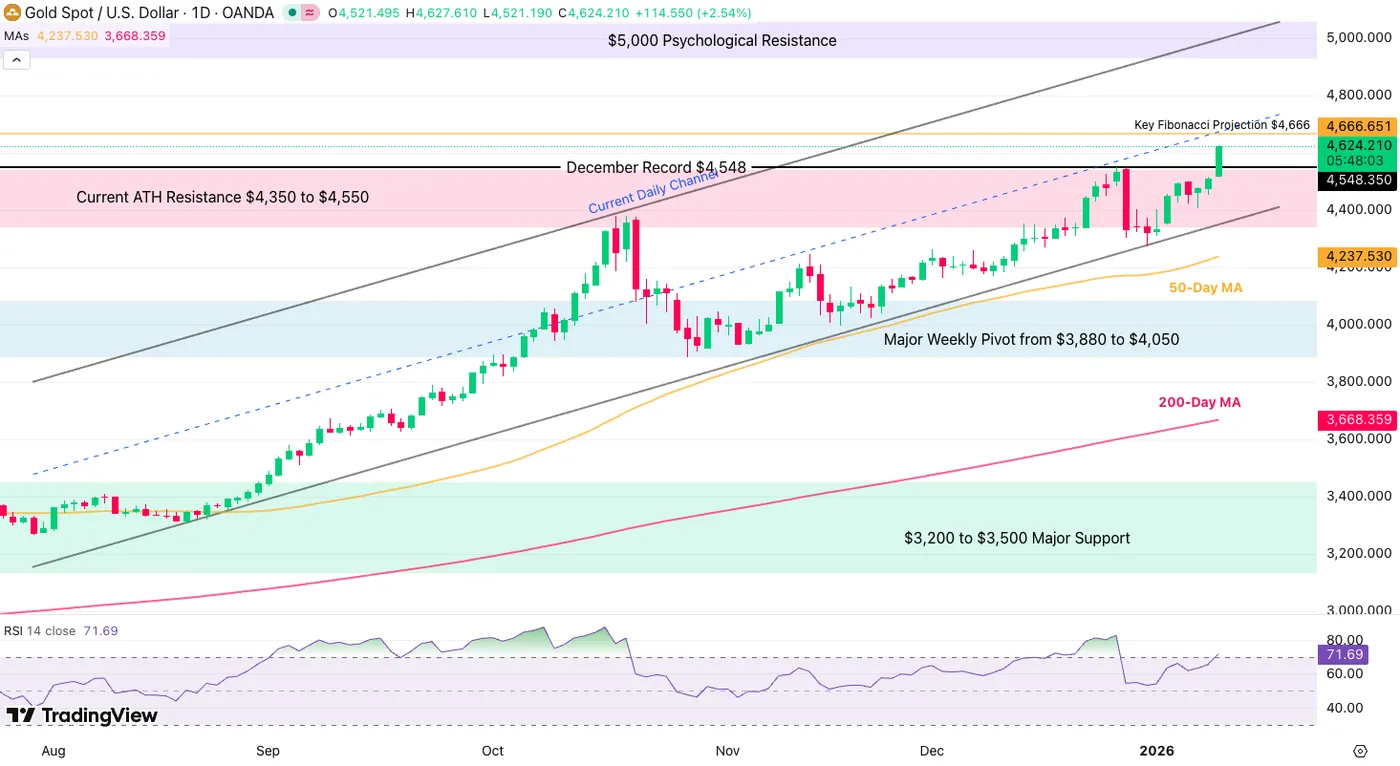
Gold (XAU/USD) Daily Chart, January 12, 2026 – Source: TradingView
After the past week close above $4,500, technicals went right ahead to magnify the return of even-more bullish fundamentals for the yellow metal.
Since August, the rally hadn’t seen many retracements, but after the late-December correction, a strong upward Channel is forming, with the latest bounce being used by bulls to reach the current all-time highs.
Easily blasing beyond the Weekly divergence noted last week.
Currently at $4,630 and running, Gold will face a small technical resistance at $4,666, from a key Fibonacci projection (1.618 from 2023 Lows to mid-2025 levels).
If bulls breach the level, there won’t be much until $5,000 which coincides with the top of the Channel.
Let’s take a closer look.
2H Chart and Technical Levels
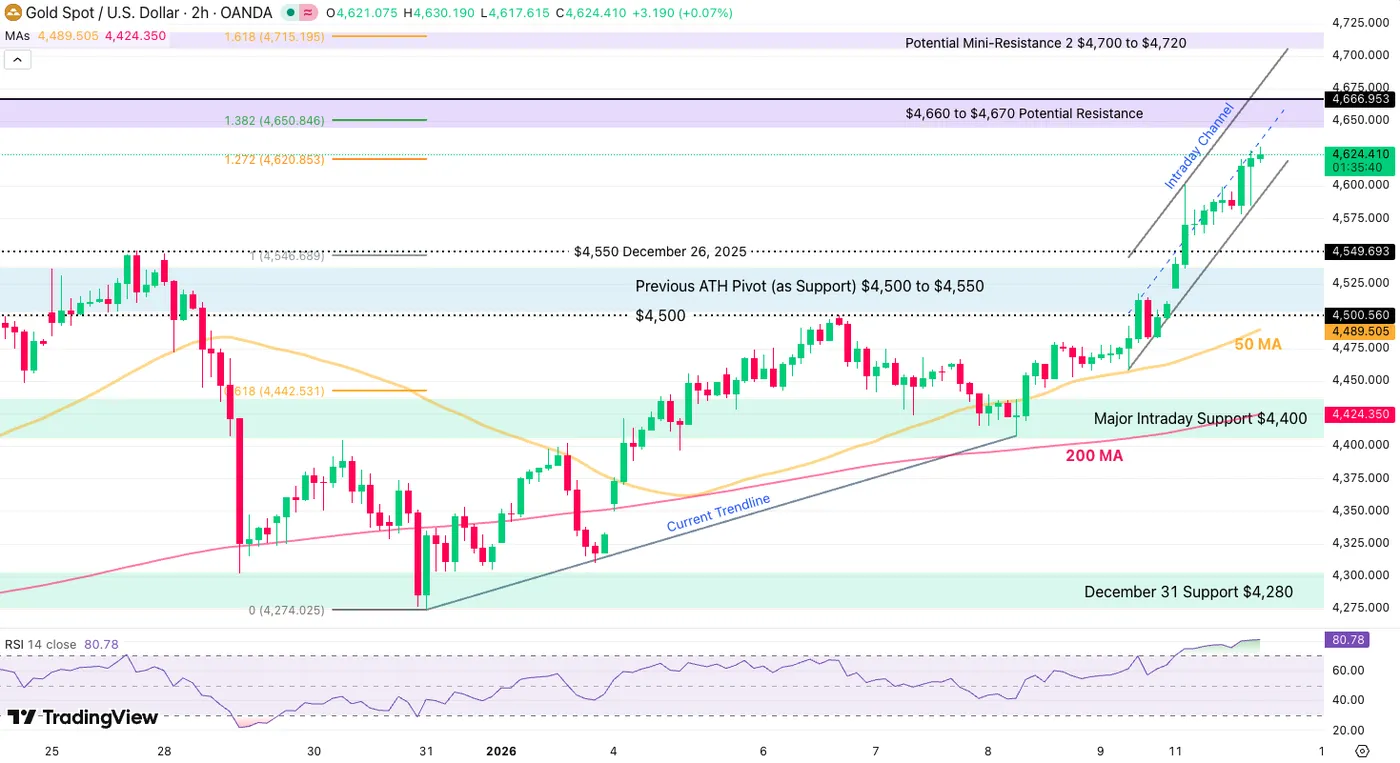
Gold (XAU/USD) 2H Chart, January 12, 2026 – Source: TradingView
Forming a tight bull channel on the intraday timeframe, nothing but some overbought conditions seem to be stopping the rally in Gold.
Reaching session highs at $4,630, the frantic buying is stalling a bit.
For pullbacks, aggressive pullback buying could take place at $4,590 (intraday channel lows).
Breaking the steep session channel would point to a retest of the previous All-Time highs around $4,550.
Levels to watch for Gold (XAU/USD) trading:
Resistance Levels
- $4,630 Current session and all-time High
- $4,660 to $4,670 Potential Resistance
- Potential Mini-Resistance 2 $4,700 to $4,720
- Top of Daily Channel and Psychological Level $5,000
Support Levels
- Intraday Channel lows $4,590
- Previous ATH Pivot (as Support) $4,500 to $4,550
- Session Lows Previous ATH Pivot (as Support) $4,500 to $4,550
- Major Intraday Support $4,400 and 4H 50-MA
- December 31 Mini-Support Support $4,280
- Weekly Major Pivot $3,950 to $4,000
Silver (XAG/USD) Daily and 2H Charts
Daily Chart
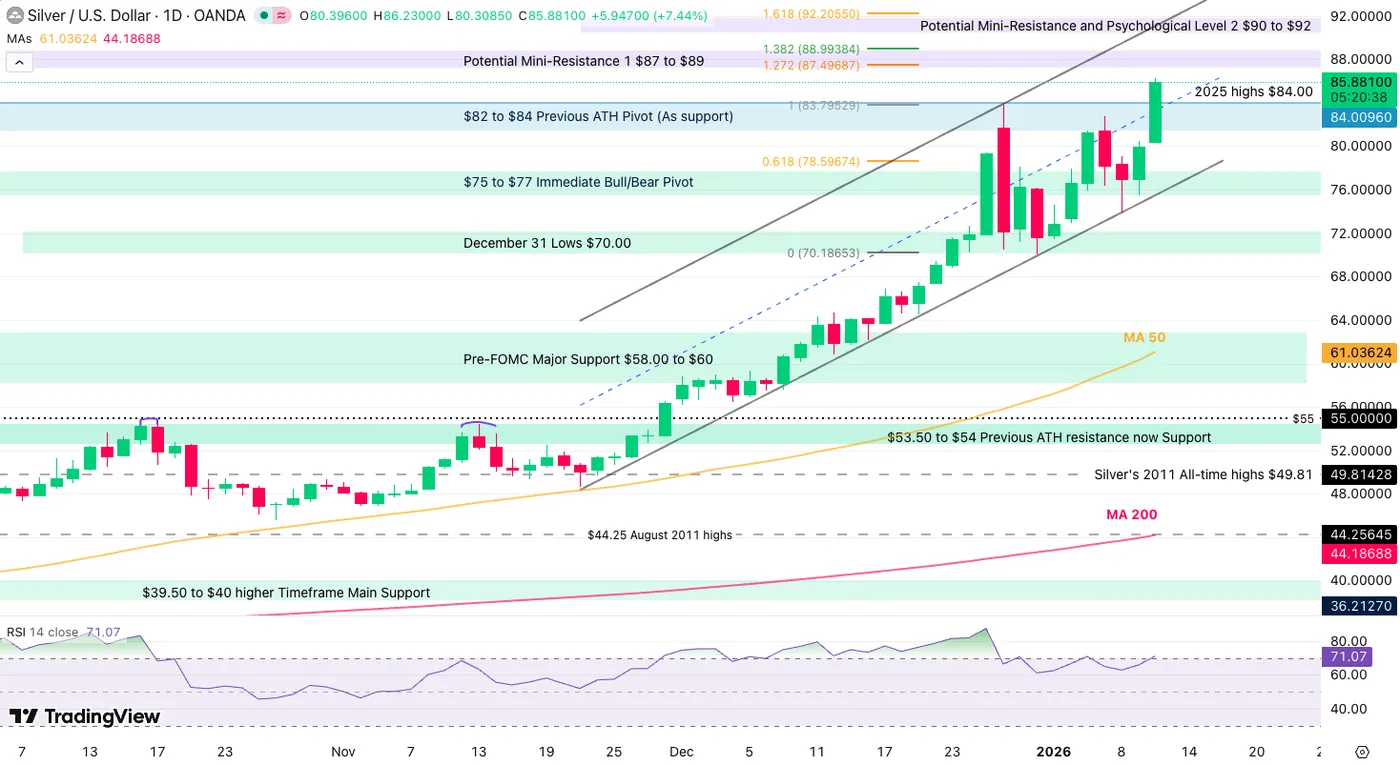
Silver (XAG/USD) Weekly Chart, January 12, 2026 – Source: TradingView
The action in XAG/USD is starting now looking insane.
Silver is leading its peers yet again in today’s action, up around 8% in a huge bullish candle in today’s action, easily breaching beyond the $85 psychological level, leaving more technical upside to the rally.
Also forming a Daily Channel, no resistance is emerging before the $88 to $89 Fibonacci Area.
Except for any major fundamental change (like world peace or a return of Fed Hikes), nothing is looking to stop the run.
Let’s see what intraday charts are telling us.
2H Chart and Technical Levels
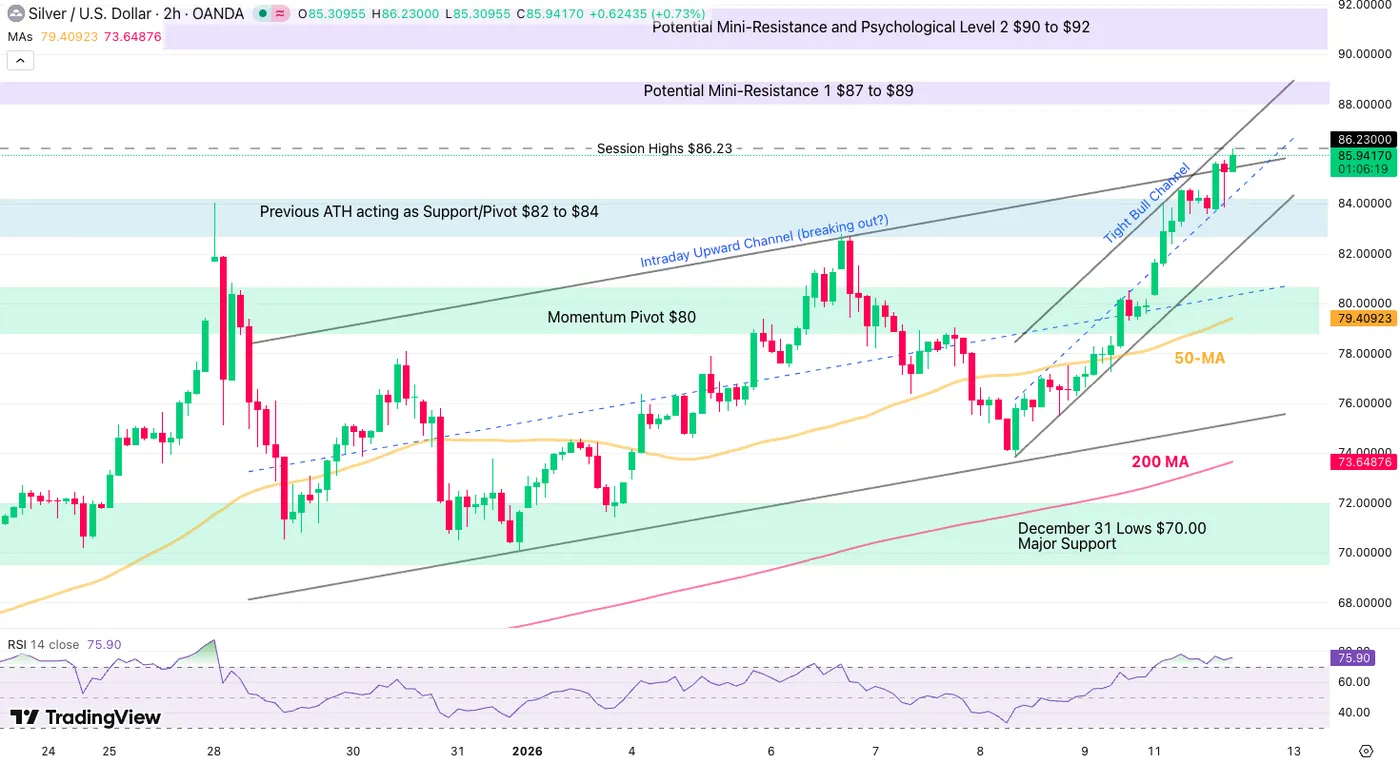
Silver (XAG/USD) 2H Chart, January 12, 2026 – Source: TradingView
With the action now stalling a bit after the tumultuous overnight/morning action, Silver traders will be looking at two technical elements:
- Whether bulls manage to fully break above the Sideways Channel (testing a breakout)
Or follow the steep Tight Bull Channel from the current session, pointing to even more aggressive action.- Breaking below this one hints at a retest of the $80.00 Momentum Pivot.
- Maintaining the momentum would easily guide the action to $88 and potentially more.
To put things into perspective, SIlver is up 77% since Williams comments hinted at a December Fed Cut!
Levels to watch for Silver (XAG/USD) trading:
Resistance Levels:
- $86.23 Session and All-Time Highs
- Potential Mini-Resistance 1 $87 to $89
- Potential Mini-Resistance and Psychological Level 2 $90 to $92
Support Levels:
- $82 to $84 Previous ATH Pivot (As support)
- $80.00 Momentum Pivot
- $75 to $77 Minor Support and Channel lows
- December 31 Lows $70.00
- Pre-FOMC Major Support $58.00 to $60 and 50-Day MA
Safe Trades and a Successful Week!