
EUR/USD failed to clear 1.1700 and trimmed some gains. USD/JPY managed to reclaim 158.00 and might aim for more gains.
Important Takeaways for EUR/USD and USD/JPY Analysis Today
- The Euro started a downside correction from the 1.1700 pivot zone.
- There is a bearish trend line forming with resistance at 1.1660 on the hourly chart of EUR/USD at FXOpen.
- USD/JPY climbed higher above 158.50 and 159.00.
- There is a bullish trend line forming with support near 158.50 on the hourly chart at FXOpen.
EUR/USD Technical Analysis
On the hourly chart of EUR/USD at FXOpen, the pair started a fresh increase from 1.1620. The Euro cleared a few key hurdles near 1.1650 to move into a positive zone against the US Dollar.
The pair settled above 1.1680 and the 50-hour simple moving average. A high was formed at 1.1698, and the pair started a downside correction. There was a drop below 1.1650 and the 50% Fib retracement level of the upward move from the 1.1618 swing low to the 1.1698 high.
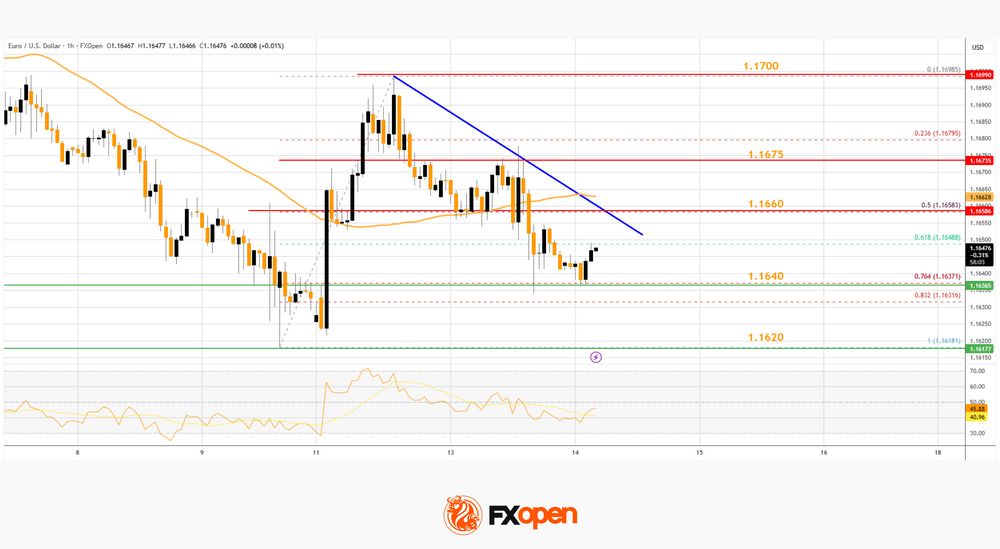
However, the bulls are active above 1.1640 and the 76.4% Fib retracement. On the upside, the pair is now facing bears near 1.1650 and 1.1660. There is also a bearish trend line forming with resistance at 1.1660.
The next breakout region sits at 1.1675. An upside break above 1.1675 could set the pace for another increase. In the stated case, the pair might rise toward 1.1700.
Immediate support is 1.1640. The first major key area of interest on the EUR/USD chart is near 1.1620. If there is a downside break below 1.1620, the pair could drop toward 1.1565. The next key breakdown area sits at 1.1550, below which the pair could start a major decline.
USD/JPY Technical Analysis
On the hourly chart of USD/JPY at FXOpen, the pair started a major increase from 157.00. The US Dollar gained bullish momentum above 158.00 against the Japanese Yen.
It settled above the 50-hour simple moving average and 158.80. The upward move was such that the pair even tested 159.50. A high was formed at 159.45 and the pair is now consolidating gains. There was a minor pullback below 159.20.
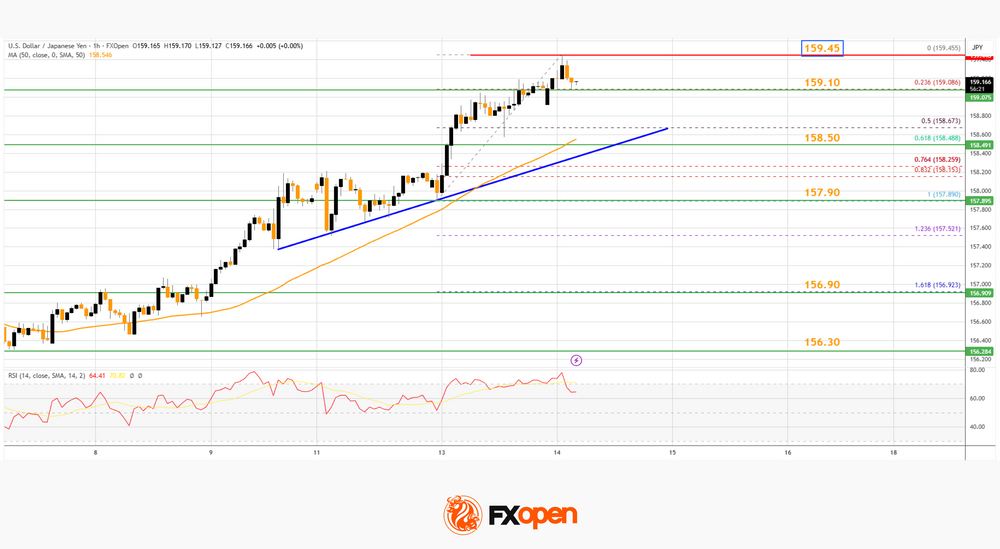
The pair tested the 23.6% Fib retracement level of the upward move from the 157.89 swing low to the 159.45 high. The current price action is positive, and the pair seems to be aiming for more gains. There is also a bullish trend line forming with support near 155.50 and the 61.8% Fib retracement.
Immediate resistance on the USD/JPY chart is near 159.45. The first key hurdle sits at 159.50. If there is a close above 159.50 and the RSI moves above 75, the pair could rise toward 160.00.
The next stop for the bulls might be 160.80, above which the pair could test 162.00 in the coming days. On the downside, the first major support is 159.10. The next area of interest could be near the trend line at 158.50.
If there is a close below the trend line, the pair could dip and test 157.90. Any more losses could open the doors for a move toward 156.90.
Trade over 50 forex markets 24 hours a day with FXOpen. Take advantage of low commissions, deep liquidity, and spreads from 0.0 pips (additional fees may apply). Open your FXOpen account now or learn more about trading forex with FXOpen.
This article represents the opinion of the Companies operating under the FXOpen brand only. It is not to be construed as an offer, solicitation, or recommendation with respect to products and services provided by the Companies operating under the FXOpen brand, nor is it to be considered financial advice.