
- Natural Gas explodes to up 70% since the Friday close
- Supply bottlenecks, geopolitical tensions and oversold prices build a cocktail for price explosion
- Exploring Technical Levels for Natural Gas
Natural Gas, historically highly correlated with WTI Oil, has largely decoupled over the past four sessions.
While the weekly correlation ranged between 0.20 and 1.00 since 2020, it has turned close to negative in late 2025.
Since the Sunday open, US Natural Gas prices have exploded by approximately 60%.
While initially attributed to fears of European supply disruptions amid recent EU-US trade tensions, the reality is more complex.
US output sits at decade lows.
Persistently low prices have disincentivized production following the record output of 2023-2024, creating a supply bottleneck just as the Northern Hemisphere enters its coldest period.
This winter differs significantly from recent years. Previous warm seasons created storage gluts and led to assumptions that milder winters were the new norm. However, the current reality is harsh (This current winter is a cold one, based in Montreal I can only confirm), challenging those assumptions.
Simultaneously, power generation demand is surging.
The need to power AI data centers and metal smelting operations—sectors currently seeing high demand—is outpacing futures delivery schedules, fueling this price acceleration.
Stress on the system is amplified by the US’s role as the world’s leading LNG exporter, particularly to Europe following the closure of Russian supply routes.
Consequently, demand spikes or supply troughs in Europe now have immediate impacts on US spot prices.
The market is facing a perfect storm: a severe winter, rising global energy demand, and escalating tensions between key suppliers and constrained consumers.
Add to this the instability in Iran—holder of the second-largest proven gas reserves—and persistent global conflicts, and the result is an explosive mix for prices.
We will now dive into the Natural Gas charts, ranging from daily to intraday timeframes, to identify the trajectory of this squeeze, potential retracement levels, and historical context.
Natural Gas Multi-Timeframe Technical Analysis
Weekly Chart
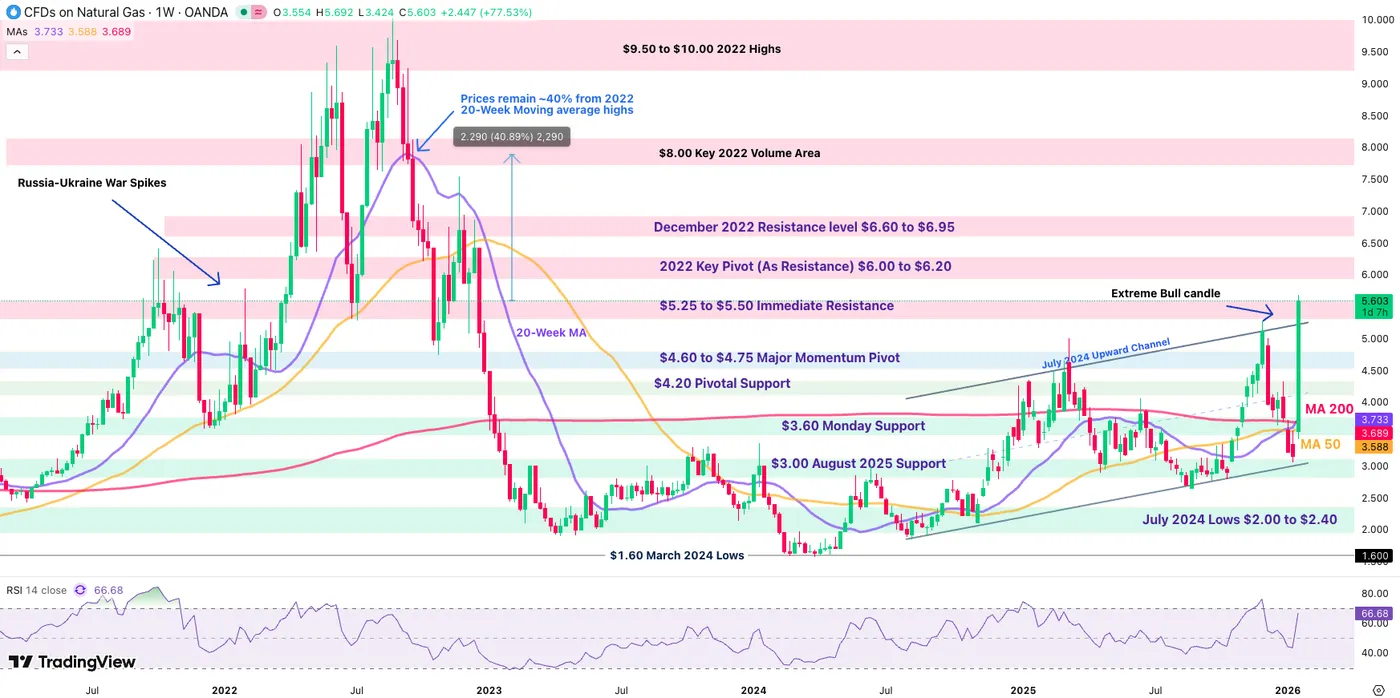
Natural Gas (ETF) Weekly Chart – January 22, 2026 – Source: TradingView
Natural Gas is posting a gigantic Bullish Marabozu candle (which doesn’t show any wicks) indicating high pressure to the current Market.
Now breaking outside of its 2024 Upward Channel, further upside could easily be warranted.
The RSI is quickly moving to overbought levels and the daily action faces a short-term challenge at the 2022 Pivotal Resistance ($5.25 to $5.50).
Current prices remain about 40% to the 20-Week MA highs (which got up to $7.194)!
To trade Natural gas with close precision and further clues on physical supply/demand balances, keep a close eye on the EIA’s daily reports – Today In Energy.
Moving averages will be long to catch up to such a squeeze and won’t serve as ideal technical indicators on higher timeframes (Weekly, Daily).
One may rather look for support and resistance levels and Fibonacci-retracements for entries and exits.
Daily Chart and Technical Levels
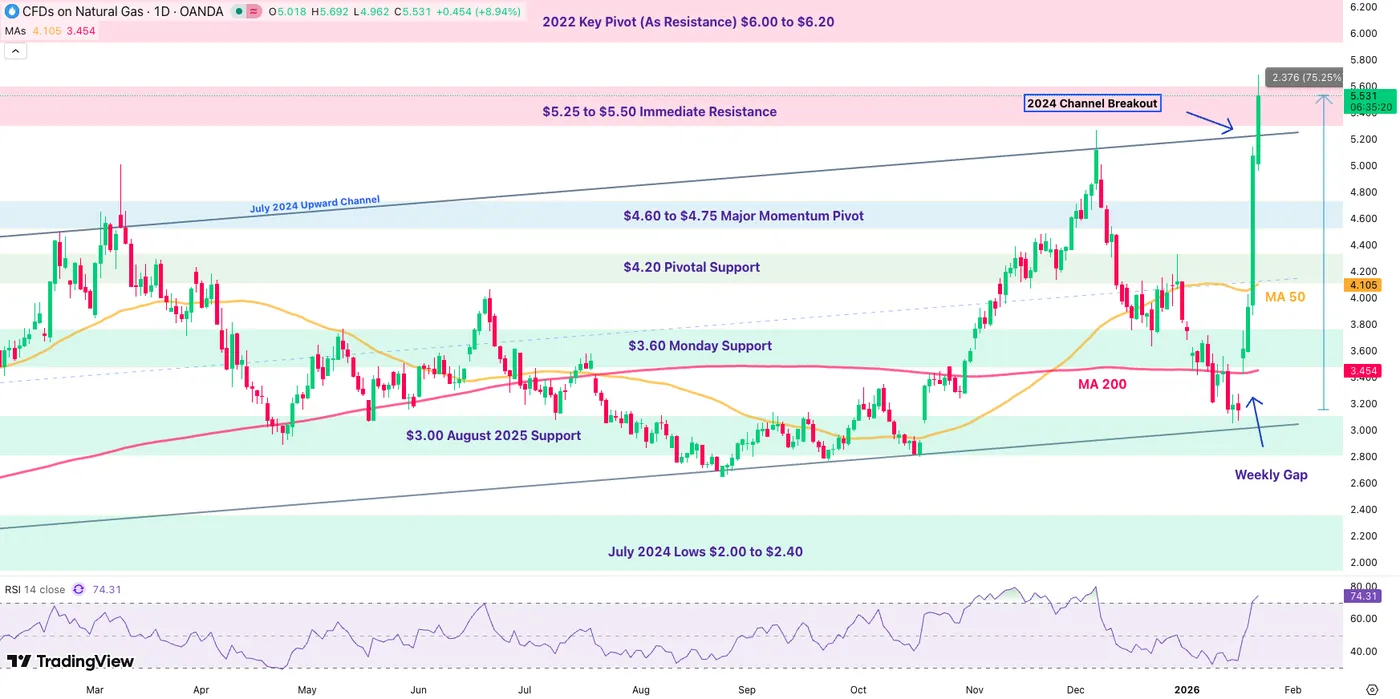
Natural Gas (ETF) Daily Chart – January 22, 2026 – Source: TradingView
The 75% rise since Friday close is a frightening picture – This weekly close will be very key for upcoming action. See why on the intraday timeframe just below.
Levels of interest for Natural Gas trading
Resistance Levels
- $5.30 to $5.50 Immediate Resistance
- $5.68 Session and Weekly Highs
- 2022 Key Pivot (As Resistance) $6.00 to $6.20
- December 2022 Resistance level $6.60 to $6.95
- August 2022 Record $10.15
- ATH in 2005 at $15.51
Support Levels
- $5.00 to $5.20 Break-Retest support
- $5.00 Psychological mini-support
- $4.60 to $4.75 Major Momentum Pivot (61.8% Fib)
- $4.20 Pivotal Support ($4.10 4H MA 50)
- $3.60 Monday Support and 200-Day MA
- $3.00 August 2025 Support
2H Chart
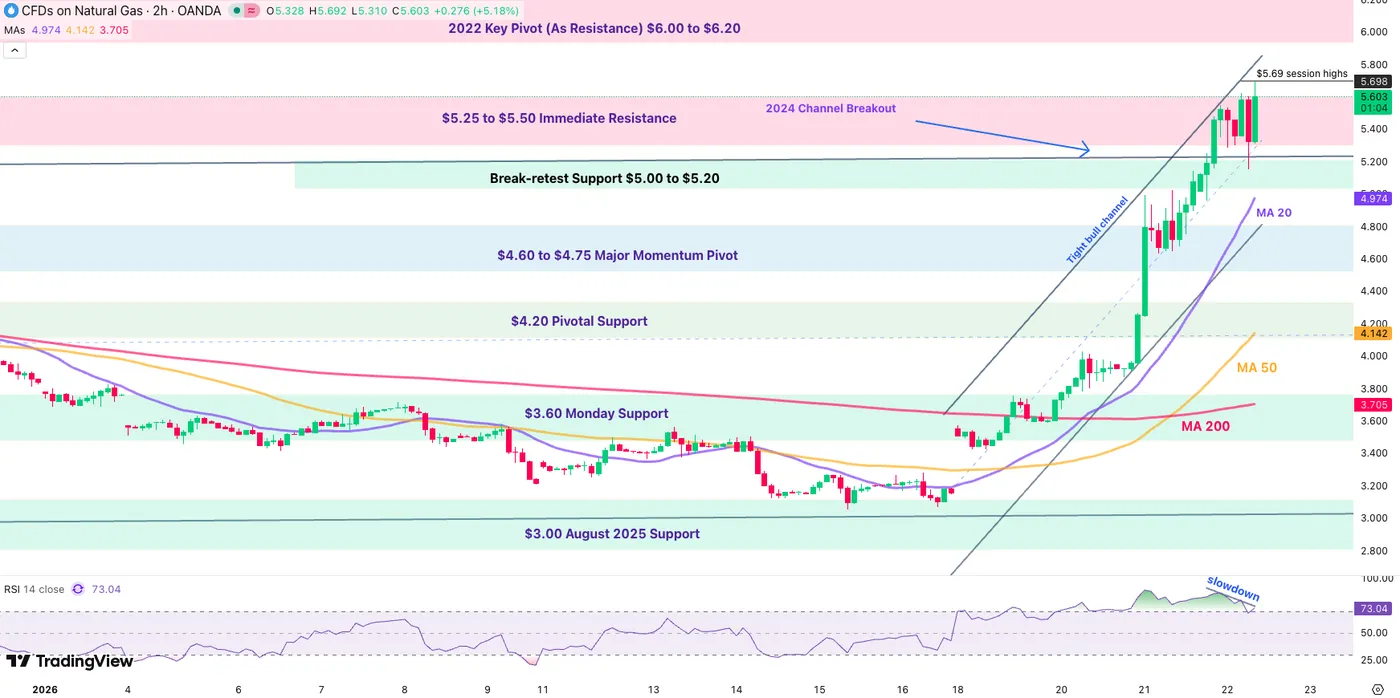
Natural Gas (ETF) 2H Chart – January 22, 2026 – Source: TradingView
Despite the extreme squeeze throughout the past few days, the action is reacting to some overbought levels and marking intermediate tops.
With the current $5.67 Wick being rejected, Nat Gas is reacting well to the $5.30 to $5.50 Resistance Zone, which will act as key barometer for bull/bear strength:
- Breaking above on the Daily hints at a quick test of the $6.00 Resistance
- Remaining here indicates a short-term pullback to the $5.00-$5.20 Break-Retest support – Look at the 2H 20-period MA.
- Correcting then bouncing from there would be the most sustainable bull-path for the commodity
- Breaking the $5.00 Support however should see a calmer price-action, extending the potential correction to $4.60 which will be an interesting Pivotal Support area.
Safe Trades!