
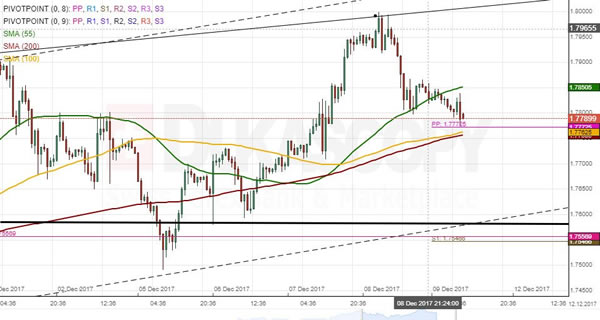
GBP/AUD was trading in a symmetrical triangle since mid-2016. This long-term pattern was breached on November 28 when the bullish sentiment that had driven the pair for the last four months provided enough strength to edge even higher. The Pound has since made a retracement from the given triangle and was trading near the psychological 1.78 mark early on Monday. It is likely that the pair is delayed near the combined resistance of the 100– and 200-hour SMAs and the weekly PP circa 1.7770. This could result in a minor period of consolidation near this area. It is expected that the Sterling depreciates against the Australian Dollar during the second half of this week in line with the prevailing channel up. On the other hand, the upside target for this week could be the monthly R1 at 1.82.


