
.)
The January FOMC is one session away, and similarly to the September Meeting, Forex Market action is quite volatile ahead of the event.
Traders are still reflecting on the many themes ongoing in Markets, including Trump Administration chaos, generational runs in Metals, Q4 Earnings, Iran, and global trade deals that are getting all over the place.
This week began on a significant gap down in the US Dollar, with the past week’s steep selling flows extending to test a significant 2025 Support (on the Dollar Index).
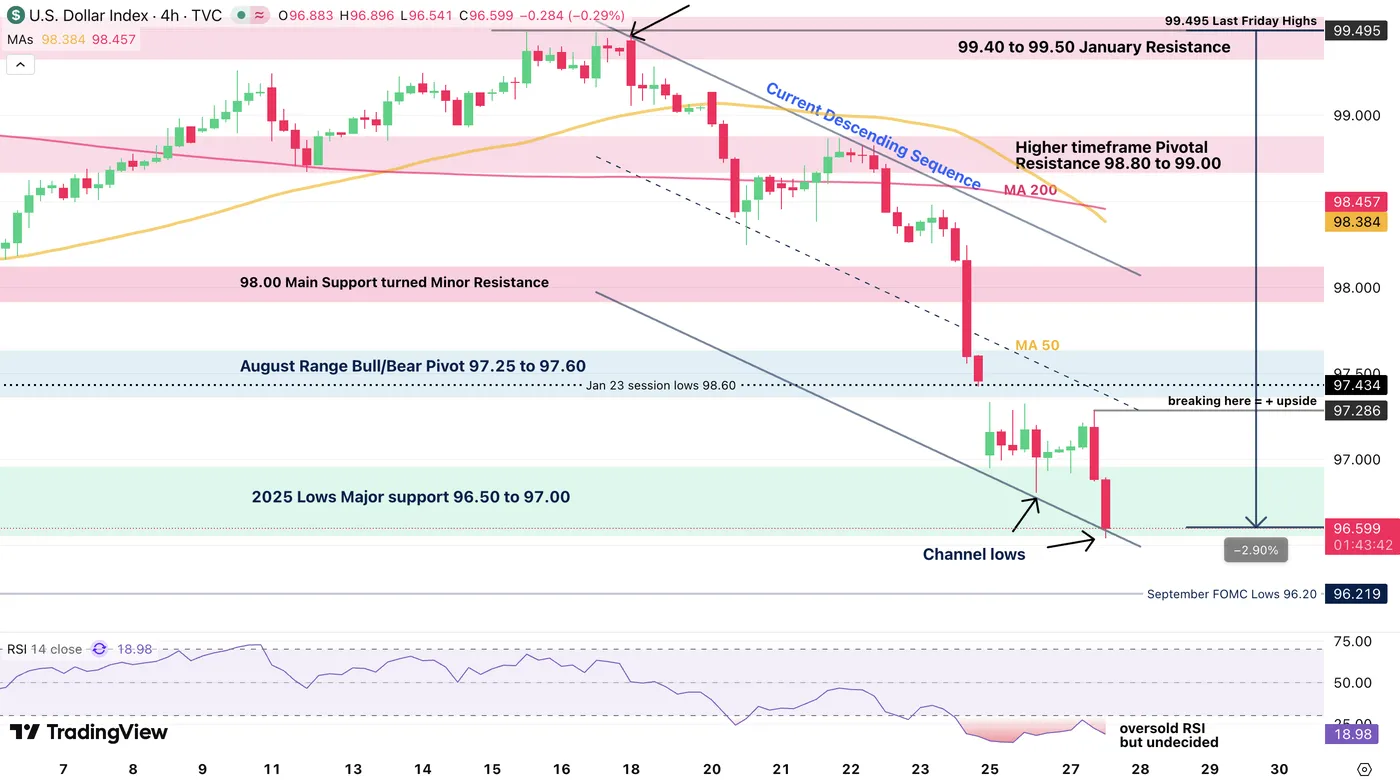
Dollar Index (DXY) 4H Chart, January 27, 2026 – Source: TradingView
Over the past week, post-Greenland threat selling flows have gathered such traction ahead of the FOMC that no mean reversion can take place.
Look for reactions around the 97.00 level after the meeting: a close above should signal further upside, and vice versa.
Some factors influencing the Dollar include the anticipated announcement of the next Fed Chair. In the meantime, there aren’t many reasons except for Dollar bulls to push their bids ahead of the meeting (14:00 E.T. tomorrow).
Other FX currencies are also doing their own thing, with picture-changing releases for Antipodean currencies, the Swissie reaching its second-highest level ever against the USD, FX intervention fears in Japan, and more.
We will dive into an intraday chart outlook for all Major FX Currency pairs and provide trading levels for the upcoming huge FOMC event.
All FX Majors Charts with the key levels in play for the September FOMC
NZD/USD 4H Chart and technical levels – Holding a Tight Bull Channel
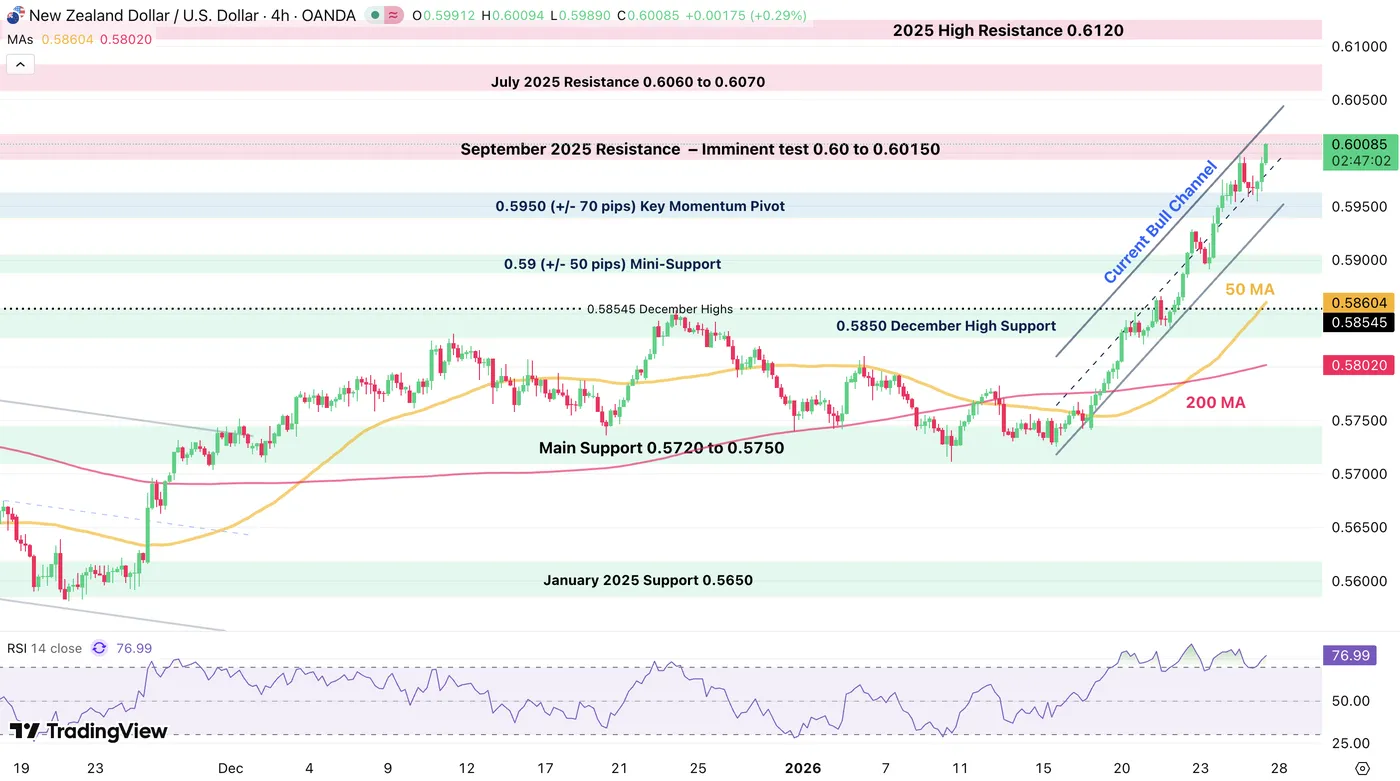
NZD/USD 4H Chart, January 27, 2026, Source: TradingView
FOMC Trading Levels for NZD/USD:
Resistance Levels
- September 2025 Resistance – Imminent test 0.60 to 0.60150
- July 2025 Resistance 0.6060 to 0.6070
- 2025 High Resistance 0.6120
Support Levels
- 0.5950 (+/- 70 pips) Key Momentum Pivot
- 0.59 (+/- 50 pips) Mini-Support
- 0.5850 December High Support
- Main Support 0.5720 to 0.5750
USD/JPY 4H Chart and technical levels – Testing key support
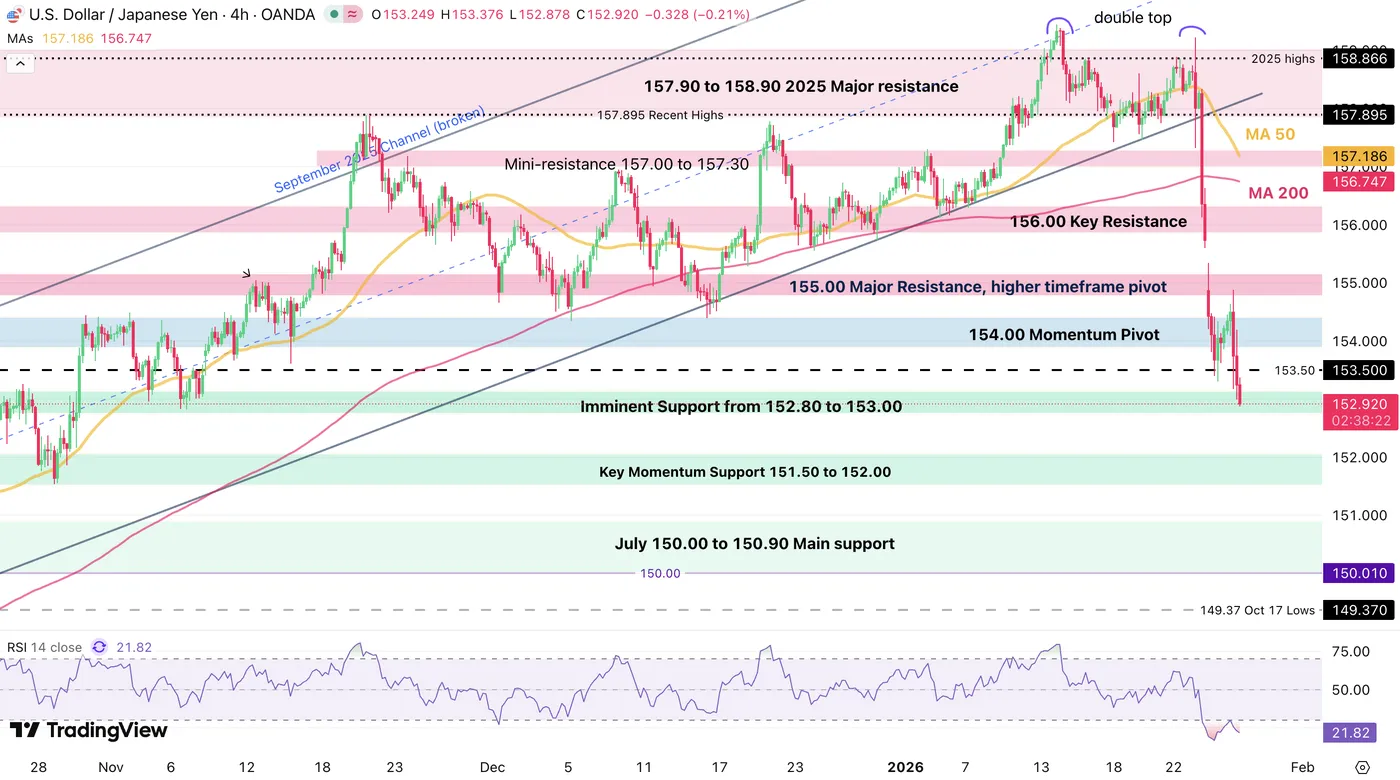
USD/JPY 4H Chart, January 27, 2026, Source: TradingView
The 4H 50-period MA is about to cross the 200 MA from above, a bearish sign but USD/JPY moves on Intervention fears – Be careful there!
FOMC Trading Levels for USD/JPY:
Resistance Levels
- 154.00 Momentum Pivot
- 155.00 Major Resistance, higher timeframe pivot
- 156.00 Key Resistance
- Mini-resistance 157.00 to 157.30
Support Levels
- Imminent Support from 152.80 to 153.00
- Key Momentum Support 151.50 to 152.00
- July 150.00 to 150.90 Main support
AUD/USD 4H Chart and technical levels – Breaking September 2024 highs
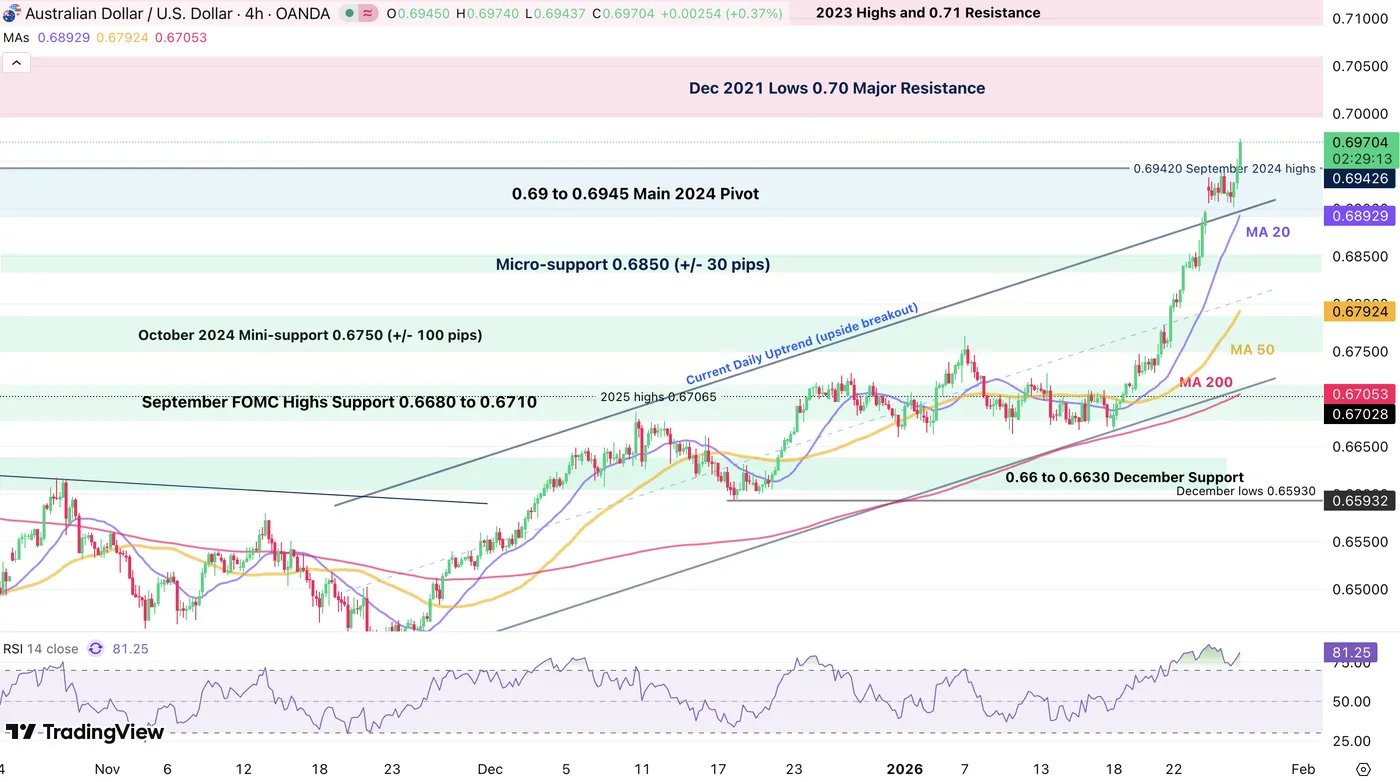
AUD/USD 4H Chart, January 27, 2026, Source: TradingView
The breakout is a huge one – Keep a close eye on the 4H 20-period MA which tracks the buying momentum well: Closing below would hint at a reversal (not looking close for now)
FOMC Trading Levels for AUD/USD:
Resistance levels
- Daily highs 0.69740
- Dec 2021 Lows 0.70 to 0.7050 Major Resistance
- 2023 Highs and 0.71 Resistance
Support levels
- 0.69 to 0.6945 Main 2024 Pivot
- 4H MA 20 0.68930
- Micro-support 0.6850 (+/- 30 pips)
- October 2024 Minor support 0.6750 (+/- 100 pips)
- 0.66 to 0.6630 December Support
EUR/USD 4H Chart and trading levels – Breaking 2025 highs
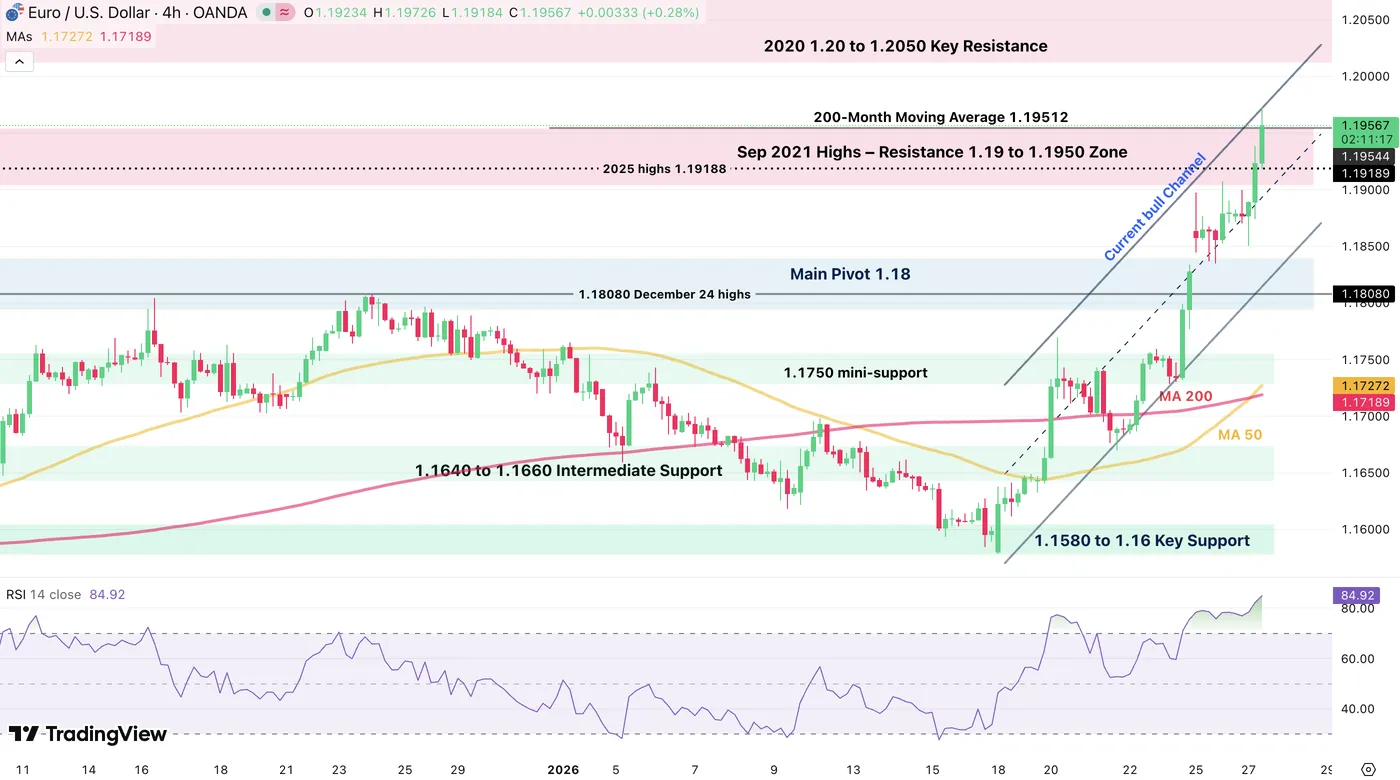
EUR/USD 4H Chart, January 27, 2026, Source: TradingView
EUR/USD is breaking out higher but watch the reactions to the 200-Month Moving Average (at 1.19510) which will act as a key Indicator for future action.
FOMC Levels to watch for EURUSD:
Resistance Levels:
- 200-Month Moving Average 1.19512
- Sep 2021 Highs – Resistance 1.19 to 1.1950 Zone (testing)
- 1.20 psychological level and 2021 highs
Support Levels:
- Main Pivot 1.18 to 1.1840 and Channel lows
- 1.1750 Intermediate Support (+/- 150 pips)
- 1.1640 to 1.1660 Intermediate Support
- 1.1580 to 1.16 January Bounce Support
USD/CHF 4H Chart and technical levels – Reaching 2nd lowest levels ever
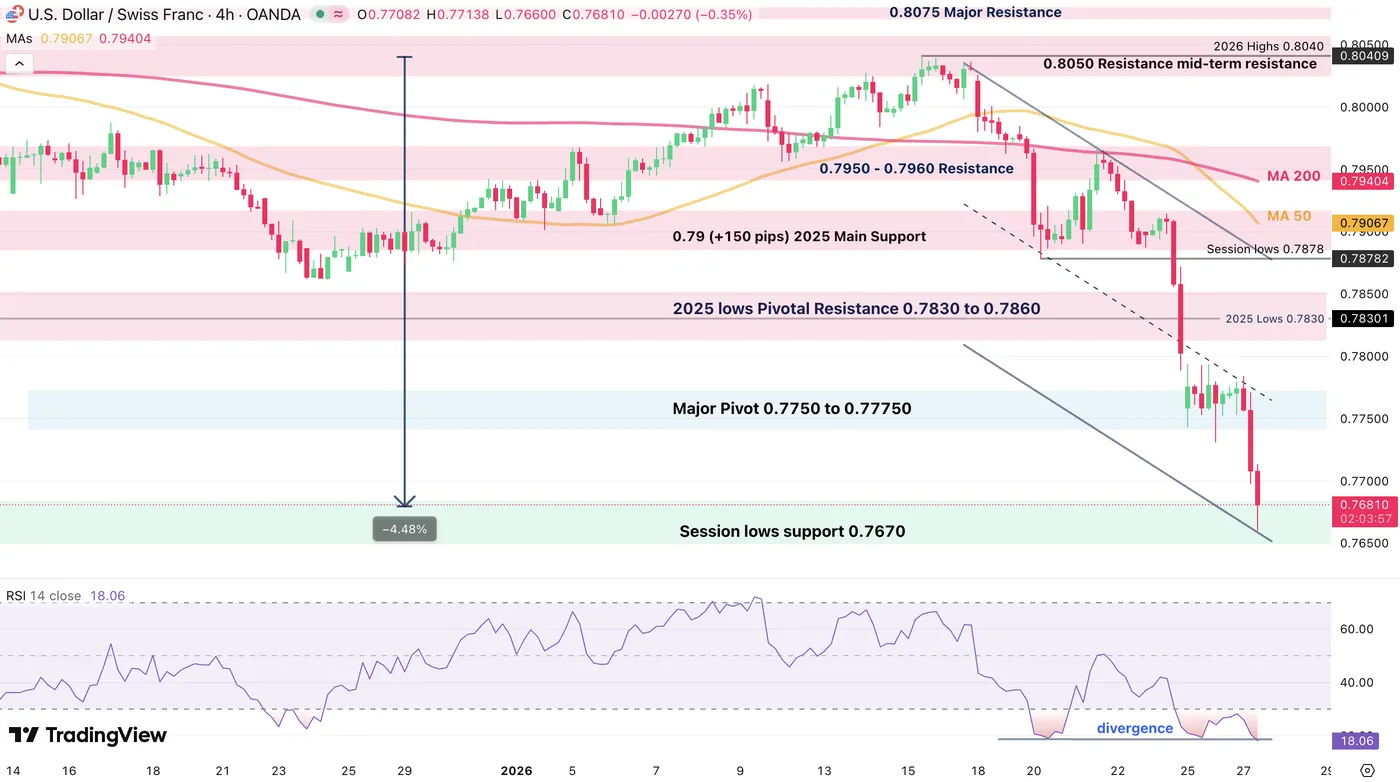
USD/CHF 4H Chart, January 27, 2026, Source: TradingView
Watch out for the consequent divergence showing up on the shorter timeframes – Reactions after the FOMC could be very swift.
Breaking current lows could lead to a test of the 0.76 Psychological level
FOMC Levels to watch for USD/CHF:
Resistance Levels
- 0.7950 Key pivot
- Long-term pivot 0.80 Zone (0.80 to 0.8010)
- Main resistance 0.8150 to 0.82 (last highs 0.8165)
- May 2025 highs 0.8475 Resistance Zone
Support Levels
- Session lows support 0.7670
- 0.7660 Session lows
- 0.76 Psychological level
- 0.70696 All-Time Lows
GBP/USD 4H Chart and trading levels – Reaching 2025 highs
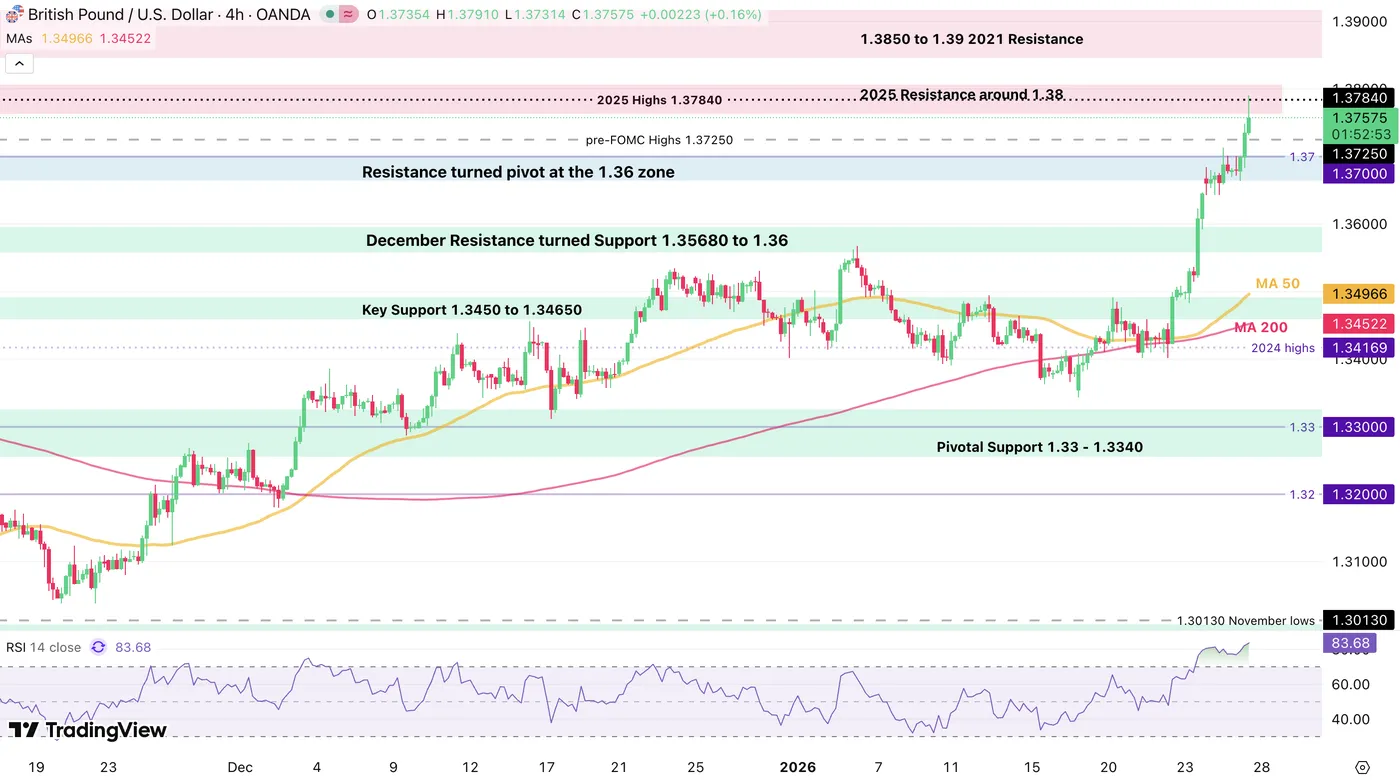
GBP/USD 4H Chart, January 27, 2026, Source: TradingView
FOMC Levels to watch for GBPUSD:
Resistance Levels
- 2025 Highs 1.37840
- 2025 Highs resistance 1.3760 to 1.38
- 1.3850 to 1.39 2021 Resistance
Support Levels
- Resistance turned pivot at the 1.36 zone
- December Resistance turned Support 1.35680 to 1.36
- Key Support 1.3450 to 1.34650
USD/CAD 4H Chart and trading levels – Reaching 2025 highs
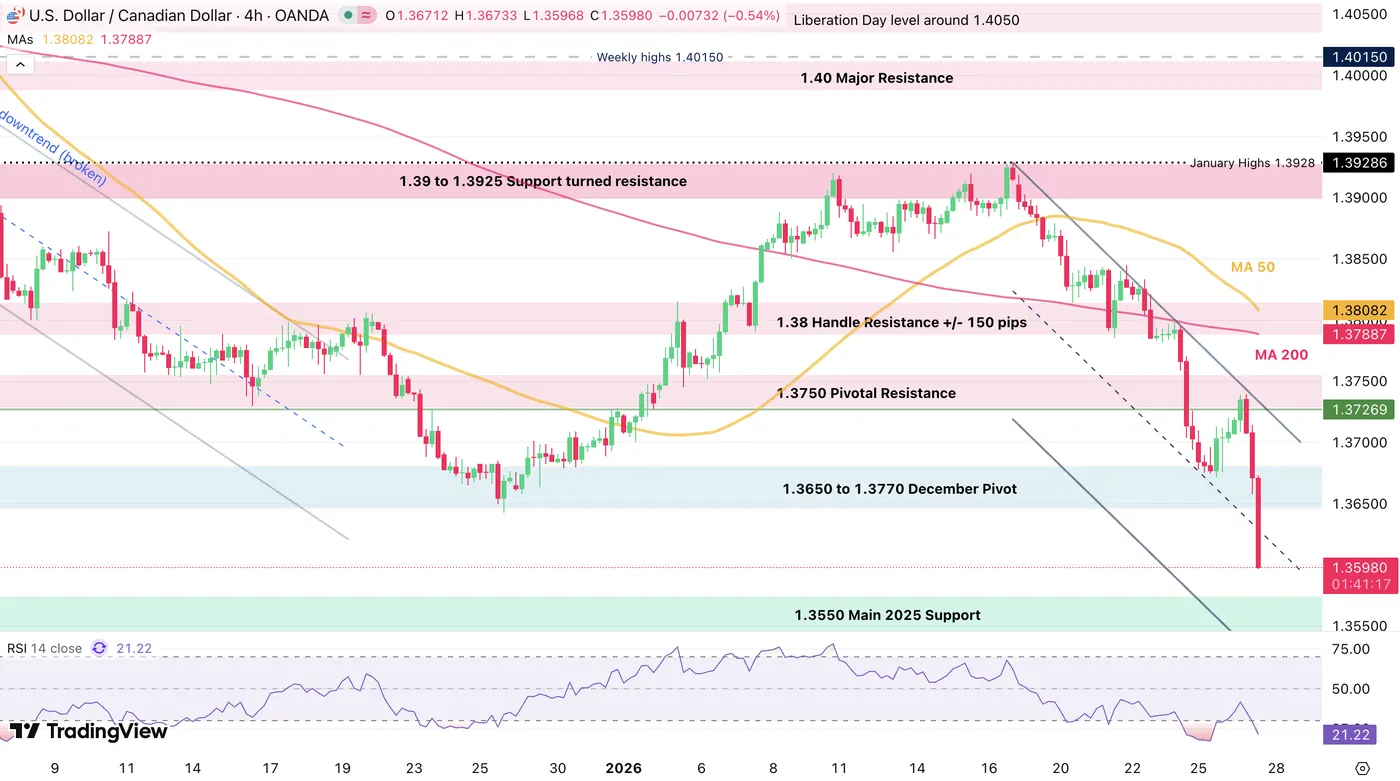
USD/CAD 4H Chart, January 27, 2026, Source: TradingView
Levels to watch for USD/CAD:
Resistance Levels
- 1.3650 to 1.3770 December Pivot
- 1.3750 Pivotal Resistance
- 1.38 Handle Resistance +/- 150 pips
Support Levels
- Session lows 1.35960
- 1.3565 2025 lows
- 1.3550 to 1.3570 Main 2025 Support
- 1.34 Next Main Support
Safe Trades as the FOMC approaches!