
Key Highlights
- Bitcoin is struggling to settle above $68,500 and $70,000.
- A bearish trend line is forming with resistance near $68,250 on the 4-hour chart of BTC/USD.
- Ethereum struggled to settle above $2,050 and $2,080.
- Gold is again moving higher above the $5,250 resistance.
Bitcoin Price Technical Analysis
Bitcoin price remained supported above $63,500 against the US Dollar. BTC climbed above $65,000 and $66,200, but the bears remained active.
Looking at the 4-hour chart, the price remained confined in a range below the 100 simple moving average (red, 4-hour) and the 200 simple moving average (green, 4-hour) amid the recent tensions between the USA, Israel, and Iran. The price attempted a recovery wave above $66,500. The price climbed above $68,000 before it faced resistance.
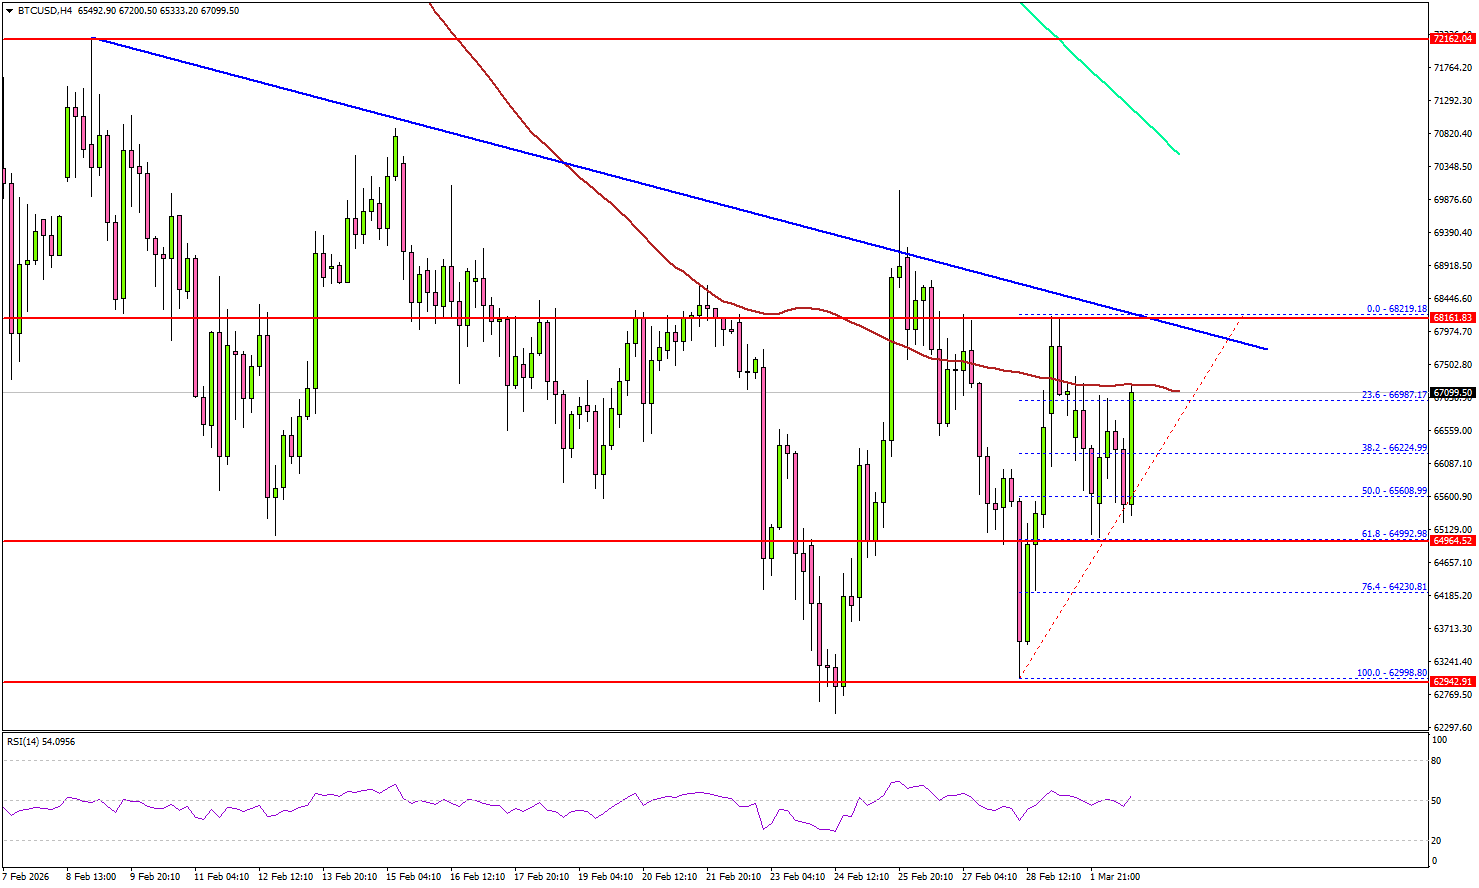
There is also a bearish trend line forming with resistance near $68,250. Immediate support sits at $65,600. The first key support could be $65,000.
A downside break below $65,000 might start another decline. The next major support is $63,000, below which BTC could decline toward $61,200.
If there is another recovery wave, the price could face resistance at $68,250 and the trend line. The first key hurdle is $69,500. A close above $69,500 could send the price toward $70,800 and the 200 simple moving average (green, 4-hour). Any more gains might call for a test of $72,000.
Looking at Ethereum, the price also remained in a range below the $2,120 resistance. If there is no close above $2,120, ETH could revisit $1,820.
Today’s Key Economic Releases
- Fed’s Schmid speech.
- ECB’s Sleijpen speech.
- ECB’s Kocher speech.
- Fed’s Kashkari speech.


