
As can be seen on the XAG/USD chart, the price of silver is recovering after forming yesterday’s low below the $79 level. The price per ounce has already exceeded $86 today (+10% in less than 24 hours!).
Volatility in the silver market is being driven by fluctuations in the US dollar, as well as military action in the Middle East, which is fuelling concerns about a prolonged regional conflict. According to media reports:
- → Yesterday, Israel carried out a strike on a building where religious figures had gathered to elect a new Supreme Leader.
- → Following the death of Ali Khamenei, he was succeeded by his son Mojtaba Khamenei. Although some sources consider him the leading candidate (no official statements have yet been made), this has raised concerns that the new Iranian leadership may continue existing policies — increasing uncertainty over the outcome of the conflict.
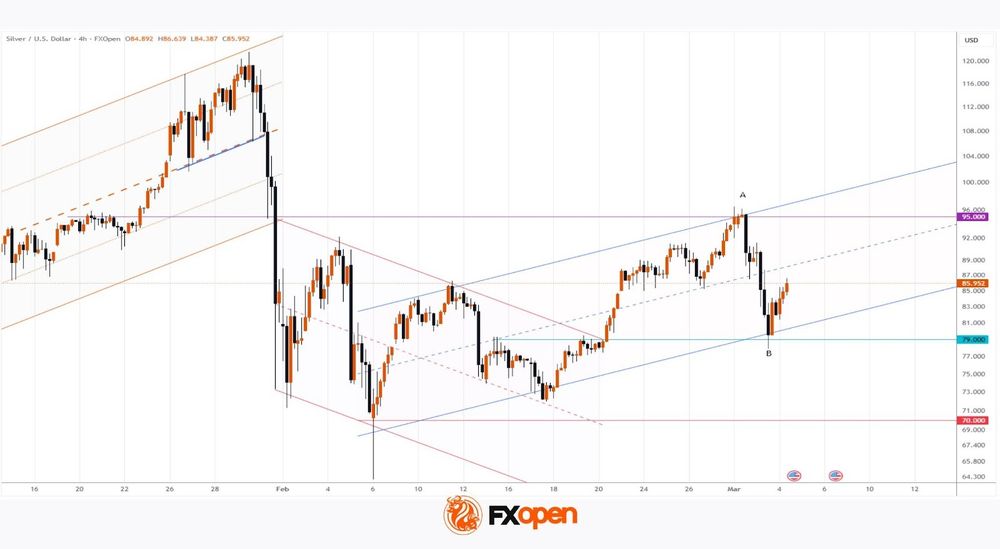
On 20 February, when analysing the XAG/USD chart, we:
- → highlighted the importance of the $95 resistance level;
- → suggested that the price of silver could consolidate above the breakout level of the descending channel around $79 (shown in red), reinforced by the psychological $80 mark.
Indeed, our assumptions were reflected in the formation of a zigzag pattern, with a bearish reversal at the A peak and a bullish reversal at yesterday’s low B. Notably, these and other key extremes make it possible to outline the contours of an upward trajectory (shown in blue).
It is possible that the upward movement observed this morning will continue during the US trading session, allowing XAG/USD to reach the blue median line. Price action at that point may provide important clues — if the median does not show signs of resistance, this may be interpreted as an indication of further upside potential.
Start trading commodity CFDs with tight spreads (additional fees may apply). Open your trading account now or learn more about trading commodity CFDs with FXOpen.
This article represents the opinion of the Companies operating under the FXOpen brand only. It is not to be construed as an offer, solicitation, or recommendation with respect to products and services provided by the Companies operating under the FXOpen brand, nor is it to be considered financial advice.


.)