
Gold price edged higher on Wednesday (up 1.6% in Asian / European trading) after falling over 4% on Tuesday.
Stronger US dollar on increased safe-haven demand and fading prospects of Fed rate cuts, pressured yellow metal, although Wednesday’s recovery, which retraced around 50% of the previous day’s drop, suggests that losses are likely to be short-lived.
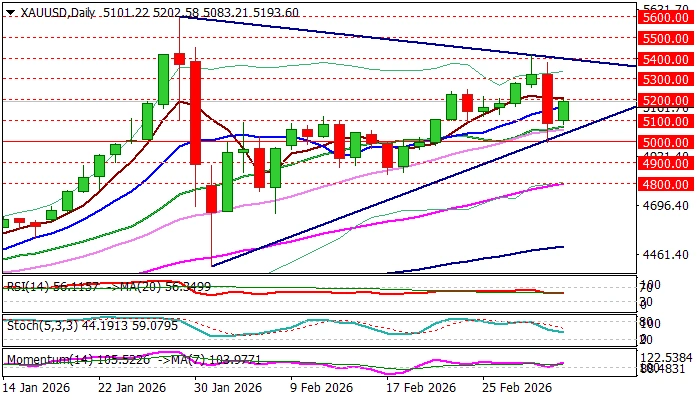
Psychological $5000 support (reinforced by daily Kijun-sen) contained Tuesday’s drop, pointing to a healthy correction of the upleg from $4402 (Feb 2 low) and keeping larger bulls in play.
Gold is expected to continue to shine as geopolitical situation (one of metal’s key drivers) remains very fragile with threats of further escalation.
In such scenario, global uncertainty is expected to deepen and further fuel safe-haven demand from the central banks, as well as individual and institutional investors.
Technical picture on daily chart has improved as MA’s returned to full bullish configuration, positive momentum strengthens and the price action remains underpinned by the daily cloud.
However, bulls need to clear significant barriers at $5200 zone (psychological / daily Tenkan-sen / 50% retracement of $5419/$4996 bear-leg), to confirm fresh bullish signal and shift near-term focus towards next targets at $5257 (Fibo 61.8%), $5300/19 (psychological / Fibo 76.4%) and $5400/19 (psychological / daily triangle upper boundary / Monday’s peak).
Broken ascending 10DMA offers immediate support at $5170, ahead of $5100 (session low / psychological), $5048 (trendline support), guarding $5000 breakpoint.
Res: 5207; 5257; 5319; 5400
Sup: 5170; 5100; 5048; 5000


 after falling over 4% on Tuesday.)