
Cryptocurrencies may have finally seen their dawn after a catastrophic performance throughout the past 6 months.
October 2025 saw new all-time highs for Bitcoin, Ethereum, XRP, and a few others, while the rest of the altcoin Market remained muted.
However, having woken towards their weak tops right ahead of a winter of sentiment and economic data, Cryptocurrencies saw their own seasonal rejection. That came after a historic year-long run in Bitcoin that took it above $100,000 for the first time.
The digital asset markets have been subject to considerable mockery, having performed the least well among the major asset classes in 2025. Still, Markets are playing the long-term game, and rotation flows can shift the narrative quickly. And that would also undermine their stellar runs since 2024.
Oil is retracing from its previous session’s $96 highs after a 10% run. That spike had a significant impact on the entire Market, as it scared investors by the prospect of higher inflation due to rising energy prices, which in turn affected production costs – but Cryptos seem to be living at their own pace.
Since the conflict, while Global Stock Markets have struggled, Bitcoin and Ethereum formed a double bottom and remained relatively protected from the general deleveraging wave seen elsewhere.
The 20 Millionth Bitcoin was mined on March 10 – and most of us (most probably) won’t be there to see the last Bitcoin mined – Supply peaks at 21 Million – sometime in about 120 years.
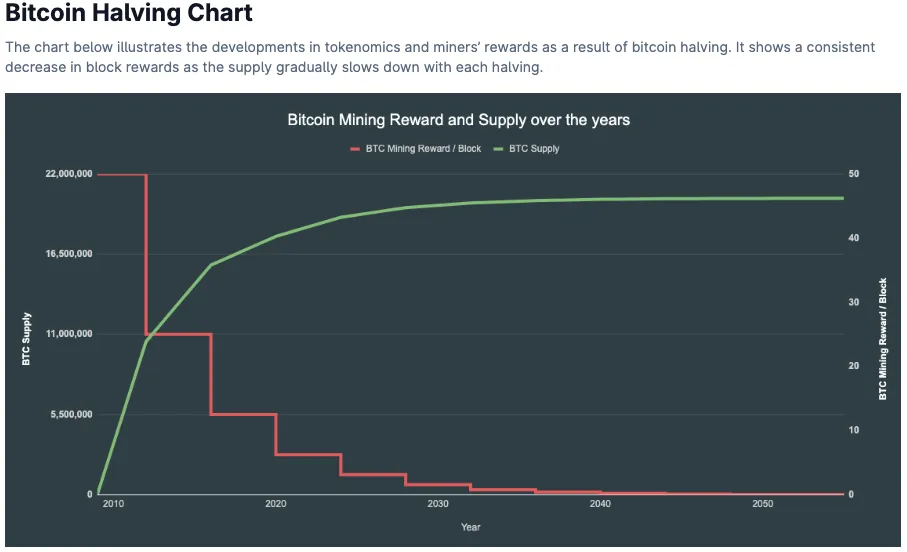
Bitcoin halving schedule towards 2050 – Source: CoinGecko
For those who didn’t know, Bitcoin’s halving rate halves the reward per mined block as more supply is being mined. This creates a sense of scarcity over time, and it has already had its greatest effect
Ethereum is also seeing its largest on-chain activity, now above its 2021 peak. This hasn’t yet fully shown up in Crypto prices, as general sentiment remains relatively weak, but it is certainly helping the case at least withstand further selling pressure.
Let’s dive right into the intraday Charts with technical levels for Bitcoin (BTC) and Ethereum (ETH).
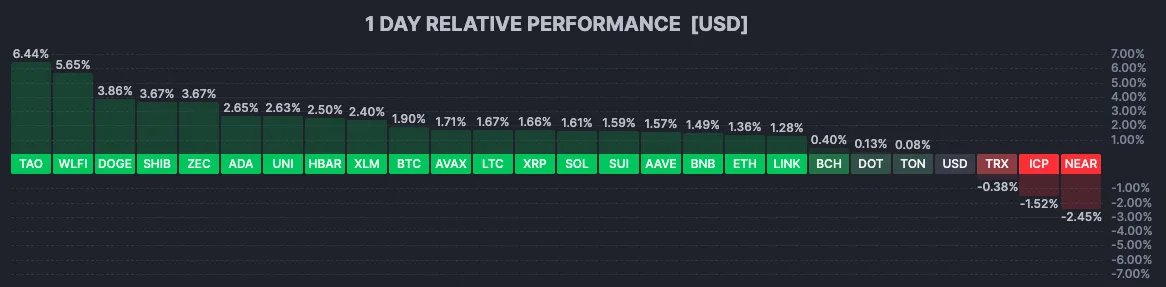
Current Session in Cryptos – March 13, 2026 (9:10). Source: FInviz
Bitcoin (BTC) 4H Chart and Technical Levels
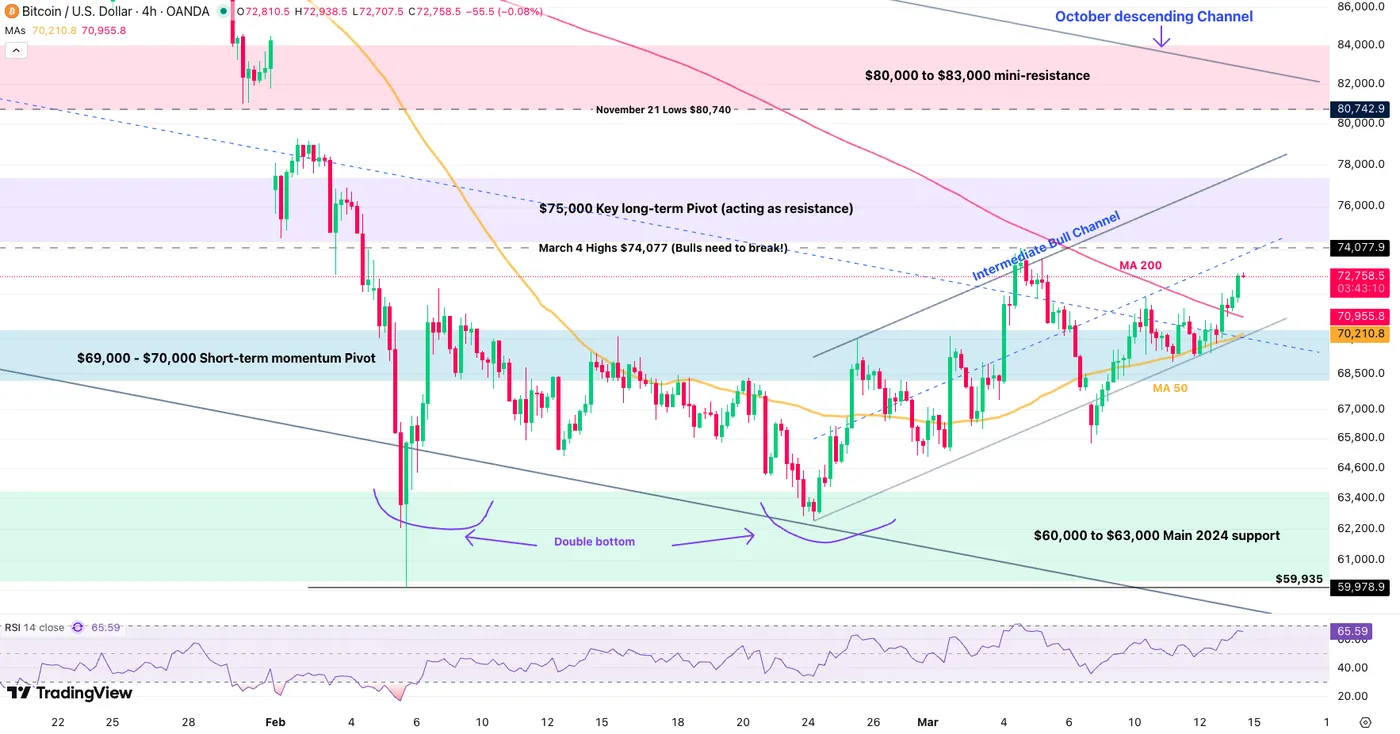
Bitcoin (BTC) 4H Chart, March 13, 2026 – Source: TradingView
Bitcoin is now evolving within a strong intermediate Bull channel, having also broken its 4H 50 and 200-period Moving Averages.
This shouts a persistent rebound in the Crypto, particularly after the recent double bottom, currently breaking $73,000.
- On the short-run, bulls will want to break the early March $74,077 highs and close above
- The top of the intermediate Channel is at $78,000
- On the longer run, it will be interesting to see what happens at $82,000, when Bitcoin tests the upper bound of its October descending channel – Breaking above could relaunch a Bull-trend.
Levels of interest for BTC trading:
Support Levels:
- $70,000 Short-term momentum Pivot (50 and 200-4H MA)
- $60,000 to $63,000 Main 2024 support (recent double bottom)
- $59,935 February Lows
- $52,000 to $58,000 Next support and 200-Week MA ($55,000 Mid-point)
- $40,000 Mid-2024 breakout support
Resistance Levels:
- March 4 Highs $74,077 (Bulls need to break!)
- $75,000 Key long-term Pivot (acting as resistance)
- $80,000 to $83,000 mini-resistance (50-Day MA)
- $90,000 to $95,000 Pivotal Resistance
- Current ATH Resistance $124,000 to $126,000
Ethereum (ETH) 4H Chart and Technical Levels
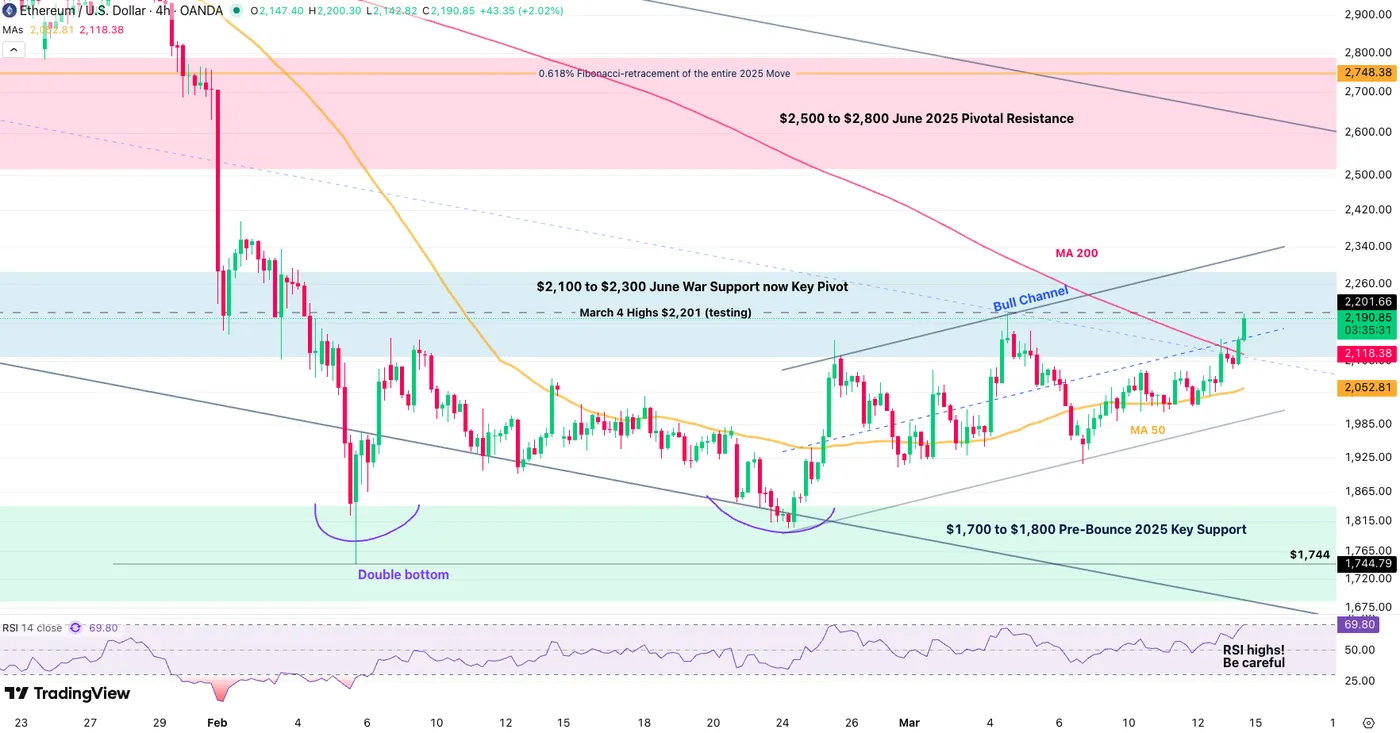
Ethereum (ETH) 4H Chart, March 13, 2026– Source: TradingView
Ethereum is also bouncing in a more progressive upward channel since its end-February double bottom.
Similarly as BTC, bulls will want to mark a clean break above $2,200 (and session close optimally) to relaunch the Bull-momentum even further.
- Above $2,300, the short-term will be bullish for Ethereum.
- The longer-run bounce will be confirmed only above $2,600.
- Watch out for some slightly overbought RSI conditions and keep a close eye on overall Market sentiment (and Oil prices)
Levels of interest for ETH trading:
Support Levels:
- 4H 200 MA $2,118
- Channel lows $2,000
- $1,700 to $1,800 Pre-Bounce 2025 Key Support (testing)
- $1,744 February 6 lows
- $1,380 to $1,500 2025 Support
- 2025 Lows $1,384
Resistance Levels:
- March 4 Highs $2,201 (testing)
- $2,100 to $2,300 June War support now Key Pivot
- $2,500 to $2,700 June 2025 Key Support now Resistance (Channel Highs)
- $3,000 to $3,200 Major momentum Pivot (Test of the $3,000)
- $4,950 Current new All-time highs


