
Key Highlights
- Bitcoin started a steady increase above $72,000 and $75,000.
- A bullish trend line is forming with support at $71,500 on the 4-hour chart of BTC/USD.
- Ethereum also climbed over 10% and surpassed $2,350.
- Gold failed to settle above the $5,200 resistance and trimmed gains.
Bitcoin Price Technical Analysis
Bitcoin price remained supported above $68,500 against the US Dollar. BTC climbed above $72,000 and $73,200 to enter a positive zone.
Looking at the 4-hour chart, the price settled above the $72,000 pivot level, the 100 simple moving average (red, 4-hour), and the 200 simple moving average (green, 4-hour). The upward move was such that the price cleared the 1.236 Fib extension level of the downside correction from the $73,926 swing high to the $70,279 low.
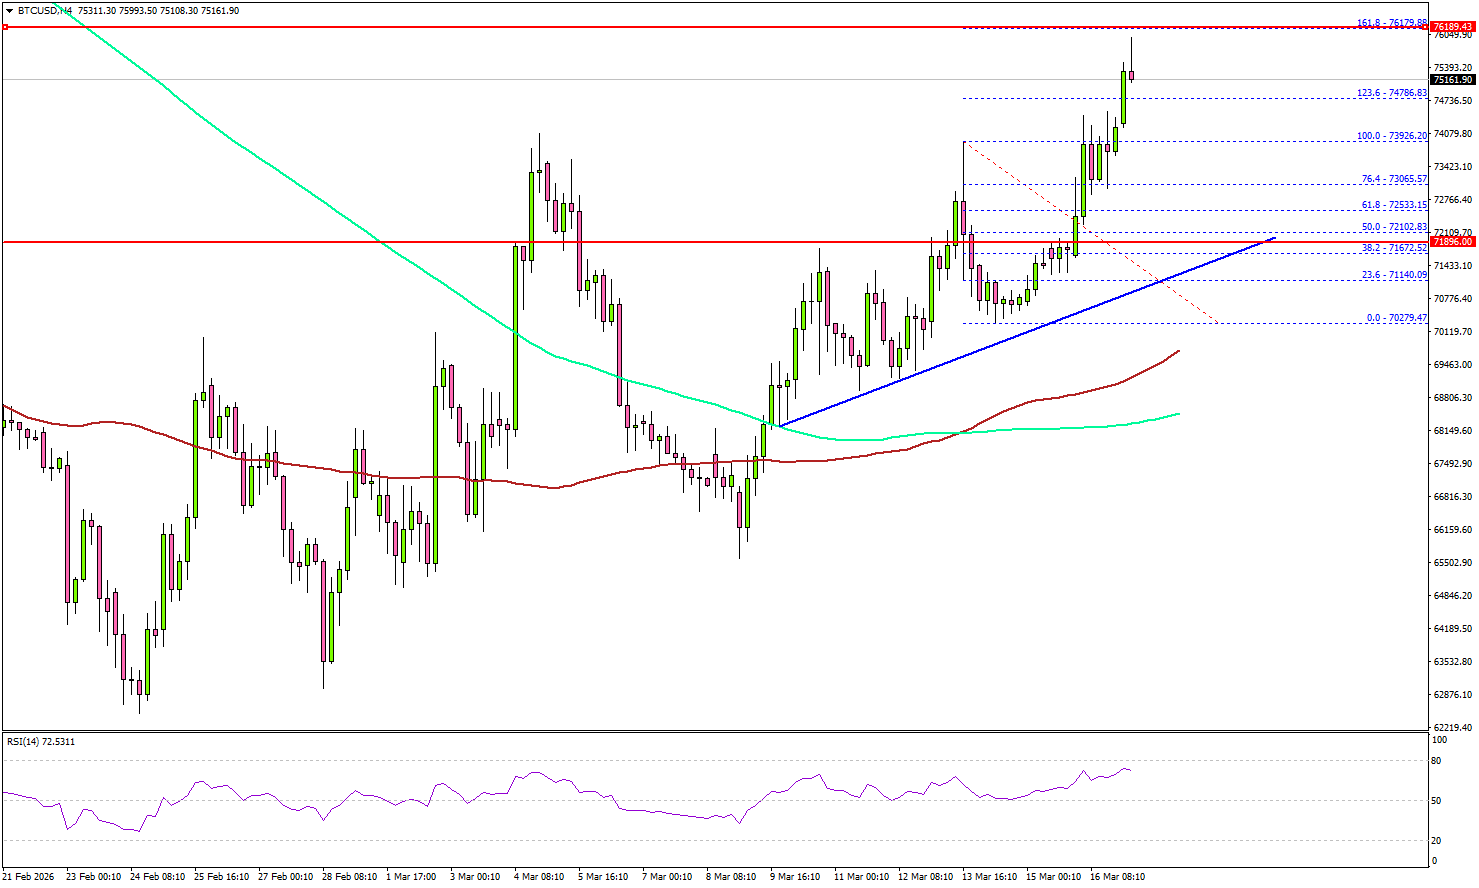
It opened the doors for a move above $75,000. On the upside, the price now faces resistance near $76,000 and the 1.618 Fib extension level of the downside correction from the $73,926 swing high to the $70,279 low.
The first key hurdle is $77,000. A close above $77,000 could send the price toward $78,800. Any more gains might call for a test of $80,000.
Immediate support sits at $74,000. The first key support could be $72,500. The main breakdown support could be near a bullish trend line at $71,500. A downside break below the trend line might start another decline. The next major support is $70,000, below which BTC could decline toward $68,500.
Looking at Ethereum, the price also gained bullish momentum above $2,250, and the bulls could now aim for a move toward $2,500.
Today’s Key Economic Releases
- US Pending Home Sales for Feb 2026 (YoY) – Forecast -0.5%, versus -0.8% previous.


