
- Gold (XAU/USD) is down 3.3%, breaking the key $5,000 psychological support level ahead of the FOMC
- The market anticipates a “hawkish hold” from the Fed, potentially delaying rate cuts to 2027, which remains a key downside risk
- Technically, the breakdown suggests the “path of least resistance” is down, with structural support at $4,760.46
- Is the selloff offering a discount ahead of the FOMC?
The price of gold is down around 2.3% on the day as the precious metal slides ahead of the key FOMC meeting later in the day.
The precious metal has been grinding all week around the $5000/oz mark and has finally made its move. This leaves market participants with an interesting conundrum, is it another buy the dip opportunity or is gold at risk of freefall?
FOMC meeting
The reason for this question is simple, markets are pretty much resigned to the fact that the Federal Reserve will keep rates on hold today. The bigger question is around the updated summary of economic projections (SEP) and how that may change.
As things stand market participants are leaning toward a hawkish tilt on that front with rate cuts likely being pushed back to 2027.
If such a move takes place, could Gold be sent on a downward spiral? Circling back to today’s move and the US Dollar has been relatively steady which should actually be a concern.
Gold prices are falling and the US dollar has not even started to recover this week’s losses. If the DXY rallies after today’s FOMC meeting that could be a catalyst for further downside in Gold prices.
Haven demand & discount opportunity
Since the February 28 war in Iran began, safe haven demand has been overshadowed by the surge in the US Dollar and diminishing rate cut bets.
One would have to think that only a major change in the current conflict and potentially some other developments around the global economy will be needed in order for Gold to receive the haven flows once more (a change in the status quo) if you will.
There is another school of thought heading into today’s FOMC meeting. It could be that market participants already expecting a hawkish Fed tilt may be frontrunning with today’s selloff.
Selling the rumor of a hawkish Fed tilt and pricing it in ahead of the actual updates later today and when the meeting takes place we could see buyers return to the fold and buy Gold at what could be considered a discount level ahead of the next potential rally.
Is this what we are seeing today? I guess we have to wait and see.
Technical Outlook – Gold (XAU/USD)
From a technical standpoint, the H4 chart illustrates a clear shift from a bullish “blow-off” top seen earlier in the month to a consolidative, slightly bearish trend.
Moving Averages & Trend
SMA (50, blue): Currently at $5,095.84. The price has slipped below this short-term trend indicator, which is now acting as immediate dynamic resistance.
SMA (100, green): Located at $5,144.74. The widening gap between the 50 and 100 SMAs suggests that the recent bearish momentum is accelerating.
Price Structure: The red box highlights a multi-day consolidation zone. The recent breakdown below this box (around $5,020) suggests that the “path of least resistance” has shifted to the downside in the short term.
Support and Resistance Levels
- Critical Resistance: $5,128.50 and $5,096.72. These levels align with the recent consolidation floor and the 50-period SMA. A break above these would be required to neutralize the bearish bias.
- Psychological Support: $5,000.00. This is the “line in the sand.” As seen on the far right of the chart, the price is aggressively testing this level.
- Structural Support: $4,760.46. This represents a major historical floor. If $5,000 fails to hold on a daily closing basis, this is the primary downside target.
Momentum Indicators
- RSI (Relative Strength Index): Currently reading 27.32.
- This indicates that Gold is in oversold territory on the H4 timeframe.
- While this often precedes a temporary bounce (mean reversion), in a strong downtrend, an oversold RSI can “stay low” for extended periods as price grinds down.
Gold (XAU/USD) Four-Hour Chart, March 18, 2026
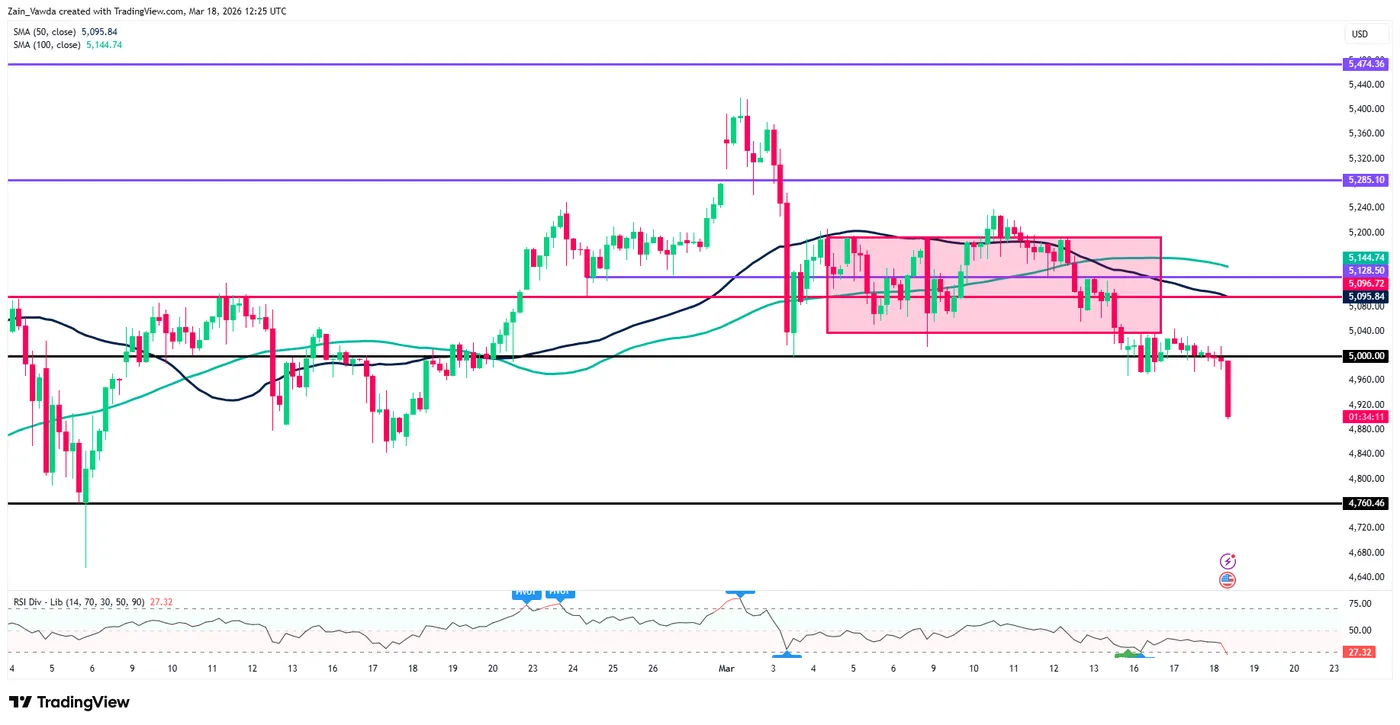
Source: TradingView (click to enlarge)


 is down 3.3%, breaking the key $5,000 psychological support level ahead of the FOMC)