
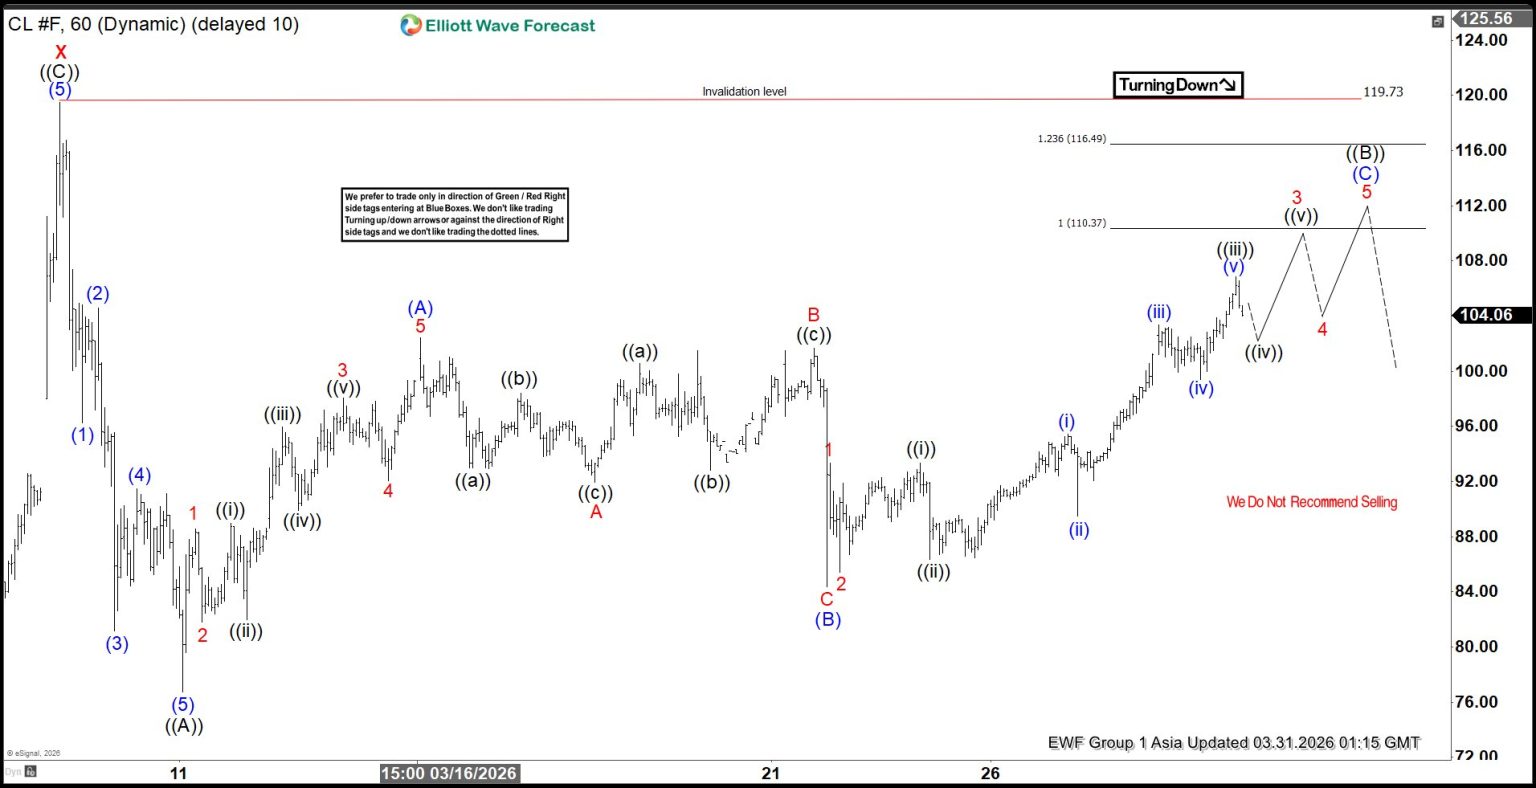
After surging to $119.7 on March 9, crude oil experienced a sharp decline, reaching $76.73 by March 11. This retreat unfolded in the form of a five-wave impulsive Elliott Wave structure, marking a decisive corrective phase. From the March 9 peak, wave (1) concluded at $96.25, followed by a rebound in wave (2) that terminated at $104.57. The subsequent decline in wave (3) reached $81.19, while wave (4) produced a modest recovery to $91.48. The final leg, wave (5), extended lower to $76.73, thereby completing wave ((A)) at a higher degree.
Currently, a corrective rally in wave ((B)) is underway, developing internally as a zigzag formation. From the termination of wave ((A)), the initial advance in wave (A) ended at $102.44. A subsequent pullback in wave (B) found support at $84.37. The ongoing rise in wave (C) carries potential to extend further, targeting the 100% to 123.6% Fibonacci extension of wave (A). This critical zone lies between $110.3 and $116.5, where renewed selling pressure may emerge. Should sellers reassert control in this region, oil prices could resume their decline in wave ((C)), provided the pivot at the $119.7 high remains intact.
Oil (CL) 60-Minute Elliott Wave Chart
CL Elliott Wave Video
You are currently viewing a placeholder content from Default. To access the actual content, click the button below. Please note that doing so will share data with third-party providers.


 concluded at $96.25, followed by a rebound in wave (2) that terminated at $104.57. The subsequent decline in wave (3) reached $81.19, while wave (4) produced a modest recovery to $91.48. The final leg, wave (5), extended lower to $76.73, thereby completing wave ((A)) at a higher degree.)