
Key takeaways
- Shift from outperformance to weakness: The Nikkei 225 has reversed sharply since late February, turning into one of the worst-performing indices amid rising stagflation fears driven by elevated oil prices and prolonged US–Iran tensions.
- Macro headwinds intensifying: Japan’s heavy reliance on oil imports, coupled with a weakening corporate earnings outlook (falling earnings revision index), is reinforcing bearish sentiment and downside pressure on equities.
- Bearish technical structure in play: The index remains trapped in a descending triangle below key resistance; a break below 52,070 may extend losses toward 50,160 and potentially the 200-day moving average, unless 54,095 is reclaimed.
Japan’s stock market has continued to wobble since the start of the US-Iran war on 28 February 2026, fading its initial bullish sparkle seen at the start of the year, where the Nikkei 225 was one of the top performers with a gain of 17% from 1 January 2026 to 27 February 2026.
Stagflation fear dragged down the Nikkei 225 to become an underperformer
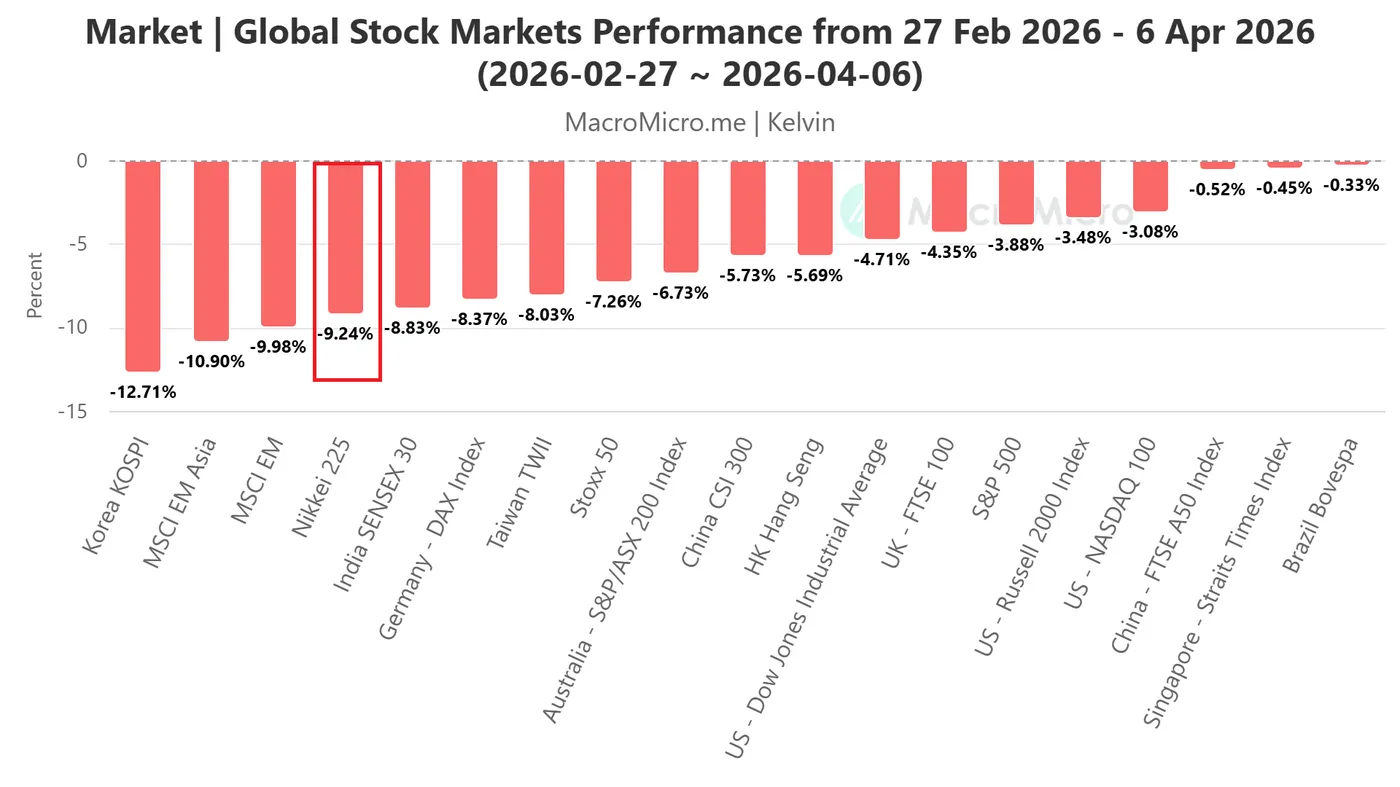
Fig. 1: Key global stock indices performances from 27 Feb 2026 to 6 Apr 2026 (Source: MacroMicro).
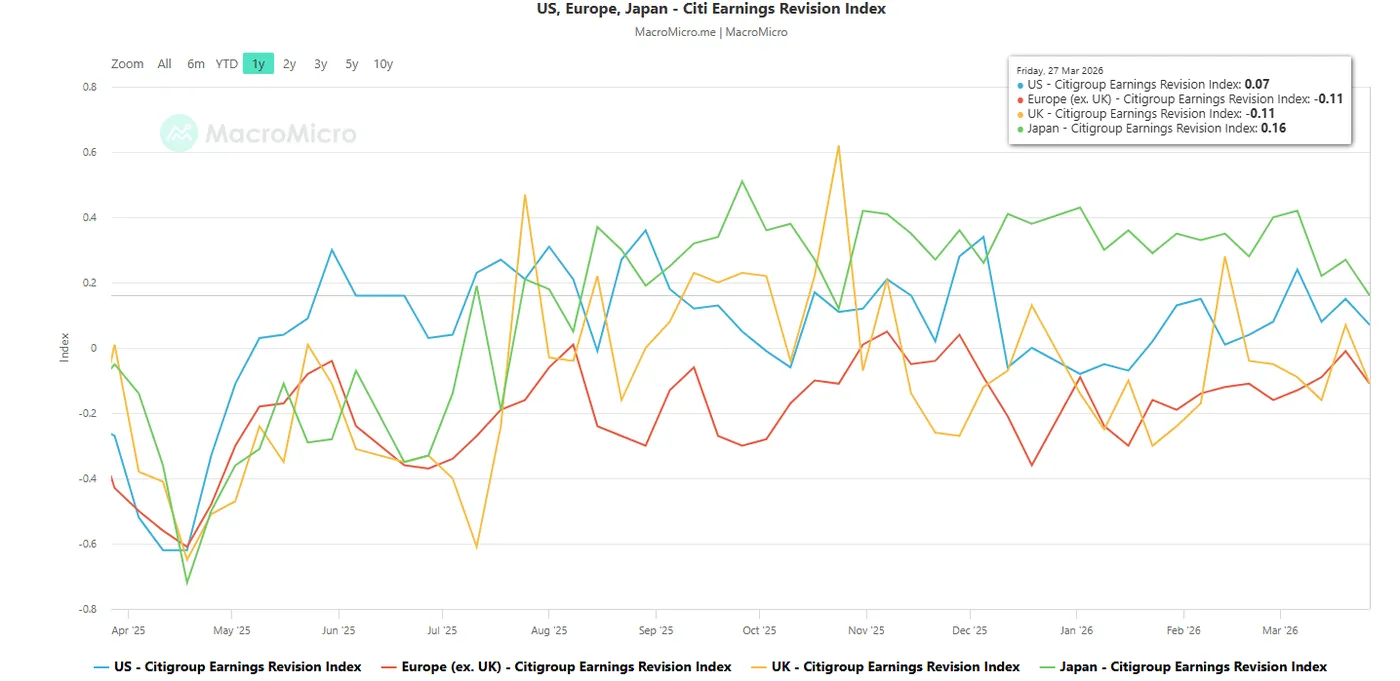
Fig. 2: Citigroup Earnings Revision Index for Japan, US & Europe as of 27 Mar 2026 (Source: MacroMicro).
In a reversal of fortune, Nikkei 225 has now fallen to the bottom, becoming one of the worst-performing stock indices, with a loss of 9.2% recorded from February 28, 2026, to April 6, 2026 (see Fig. 1).
Japan is a major oil importer, and the current US-Iran war, which is entering its 39th day, is not showing any clear signs of de-escalation at this juncture. Iran rejected a ceasefire deal yesterday after US President Trump’s latest deadline demand due today, Wednesday, 7 April at 8.00 p.m. Eastern time for Iran to open the Strait of Hormuz before US strikes on Iranian energy plants and key infrastructures.
Benchmark crude oil prices continue to trade firmly above $100/barrel, and trend-following market participants may trigger a bullish herding behaviour to continue bidding up the prices of oil.
The West Texas crude oil may rally towards the next intermediate resistances of $124.40 and $131.30/132.67.
Hence, further rallies in oil prices above $100/barrel increase the stagflation risk narrative, in turn, triggering a negative feedback loop into the Japanese economy, creating further bearish sentiment in the Nikkei 225.
In addition, the Citigroup Earnings Revision Index for Japan has slipped to a 5-month low of 0.16 as of 27 March 2026 from 0.42 printed on 6 March 2026, suggesting that sell-side analysts on average are less optimistic about the Japanese corporate earnings outlook (see Fig. 2).
Let’s now look at the technical factors to determine Nikkei 225’s potential short-term trajectory (1 to 3 days).
Nikkei 225 – Oscillating within a minor “Descending Triangle” range
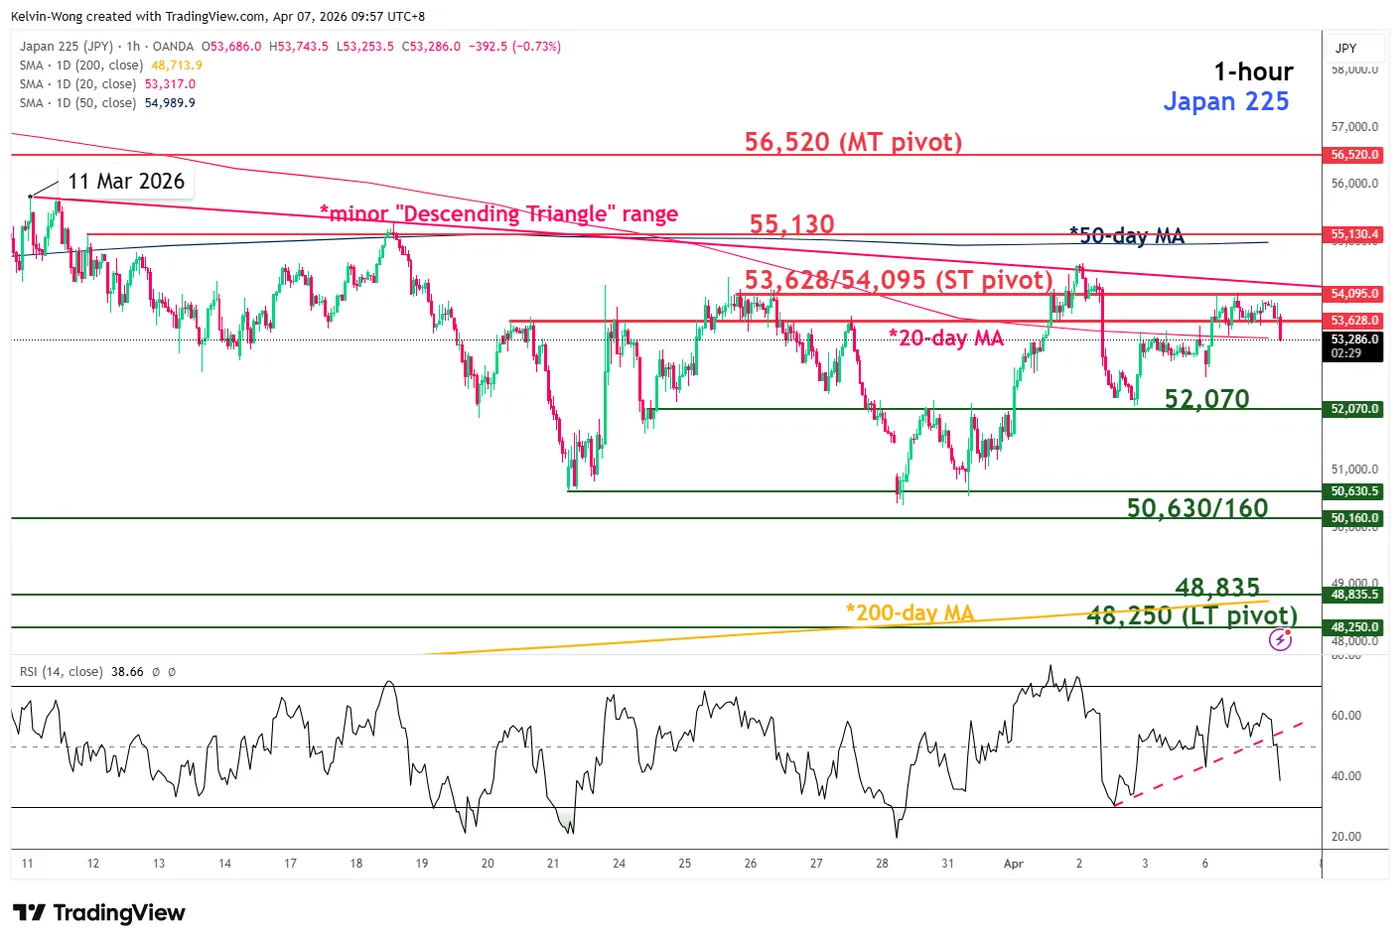
Fig. 3: Japan 225 CFD index minor trend as of 7 Apr 2026 (Source: TradingView).
Since the 11 March 2026 minor swing high, the price actions of the Japan 225 CFD index have been oscillating within a minor bearish continuation “Descending Triangle” range configuration.
The recent rebound of 8% seen from the 30 March 2026 low to 2 April 2026 high has stalled at the upper boundary of the “Descending Triangle” (see Fig. 3).
Watch the 53,628/54,095 short-term pivotal resistance zone for potential bearish reversal back down to retest the “Descending Triangle” range bottom. A break below 52,070 increases the odds of exposing the next intermediate support at 50,630/50,160 in the first step.
Below 50,160 opens scope for a bearish breakdown of the “Descending Triangle” range for a further potential down move towards the 48,835/48,250 long-term pivotal support zone (also the key 200-day moving average).
On the flip side, a clearance with an hourly close above 54,095 invalidates the bearish scenario for another leg of corrective rebound towards the next intermediate resistance at 55,130 (also the 50-day moving average).
Key elements to support the near-term bearish bias on the Nikkei 225
- The hourly RSI momentum indicator has just staged a bearish breakdown below its ascending support at the 50 level.
- The price actions of the Japan 225 have printed a “lower high” right below the “Descending Triangle” range resistance.


