
- The AUD/USD technical outlook is decidedly bullish, with the path of least resistance to the upside.
- The pair successfully broke out above the primary descending trendline on the Daily chart.
- Bullish momentum is reinforced by a “Golden Cross” formation on the 4-hour chart.
- The 0.7130 level stands as the next major hurdle for the bulls.
The Australian Dollar has undergone a significant shift in momentum over the past few sessions. After a period of corrective price action, AUD/USD appears to be finding its feet, buoyed by a successful defense of critical support zones and a breakout of descending trendline resistance.
The Daily Chart: The Big Picture
On the daily timeframe, AUD/USD remains in a broad constructive phase despite the volatility seen through February and March. The pair recently came within a whisker of the 100-day MA printing a low around the 0.6833 handle.
The most notable development on this timeframe is the breakout above the primary descending trendline (black line) originating from the year-to-date highs. After consolidating near the 0.7000 psychological handle, price action is now challenging the 0.7080 resistance. A daily close above this level would clear the path for a retest of the 0.7130 mark before the YTD highs at 0.7187 comes into focus.
AUD/USD Daily Chart, April 13, 2026
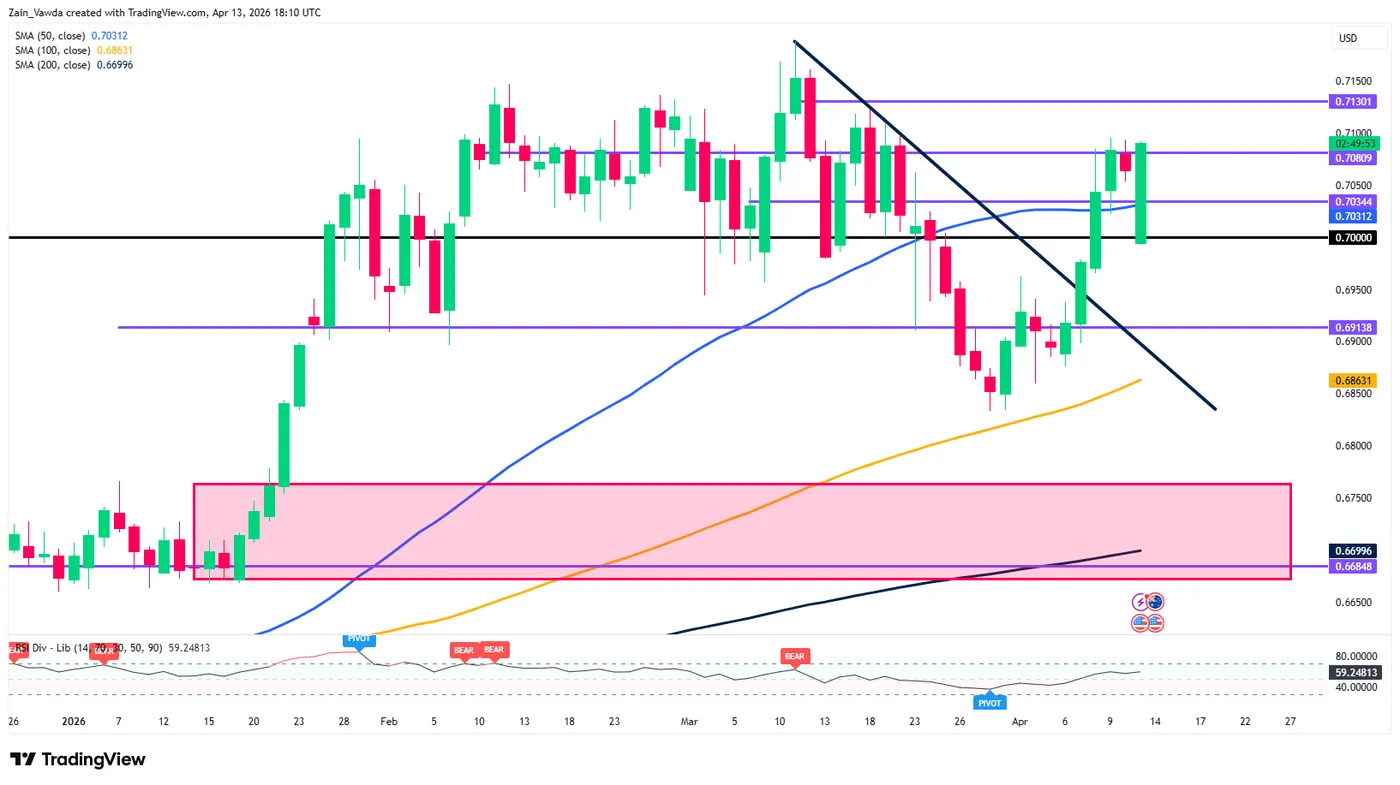
Source:TradingView.com
The H4 Chart: Bullish Momentum Accelerates
Shifting to the 4-hour chart, the bullish narrative is reinforced by the “Golden Cross” formation, where the 50-day MA has crossed above the 100 and 200-day MAs. This technical signal often precedes sustained trending moves.
We can see a clear “V-shaped” recovery from the late March lows. The pair has successfully flipped the 0.7000 level from resistance to support. Currently, the RSI (Relative Strength Index) is hovering near the 66 level; while this indicates strong bullish momentum, it suggests there is still some “headroom” before the pair reaches overbought territory, allowing for further upside in the short term.
AUD/USD Four-Hour Chart, April 13, 2026
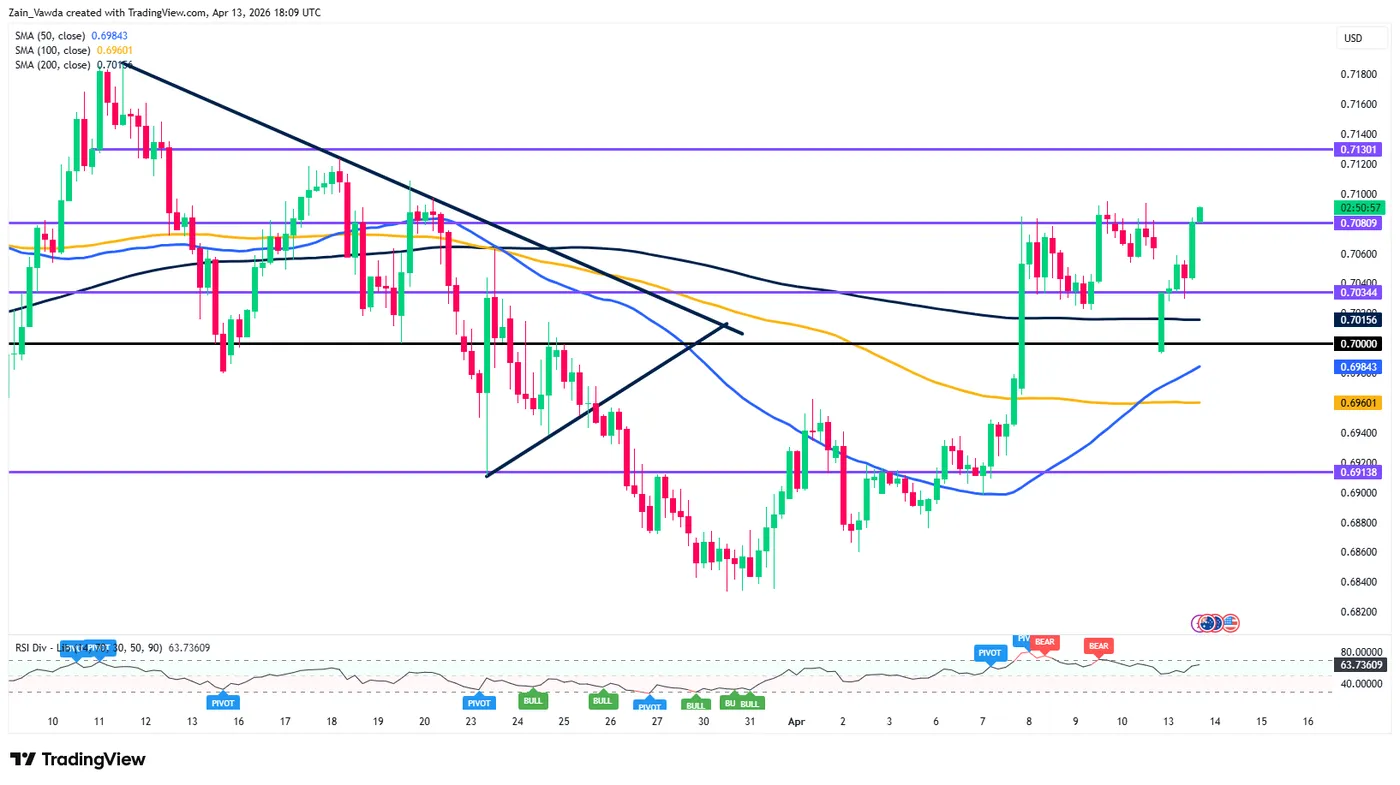
Source:TradingView.com
The H1 Chart: Intraday Precision
The 1-hour chart provides a granular look at the recent breakout. After a brief period of consolidation between 0.7034 and 0.7080, the pair has just printed a strong bullish candle, piercing the upper boundary of this range.
The intraday moving averages (50, 100, and 200) are perfectly fanned out in a bullish alignment, suggesting that any minor pullbacks are likely to be met with fresh buying interest. The immediate focus for intraday traders will be the 0.7080 level; as long as price holds above this on a retest, the next logical target is the swing high at 0.7130.
Key Levels to Watch
- Resistance: 0.7080, 0.7130, 0.7150
- Support: 0.7034, 0.7000 (Psychological), 0.6913
AUD/USD One-Hour Chart, April 13, 2026
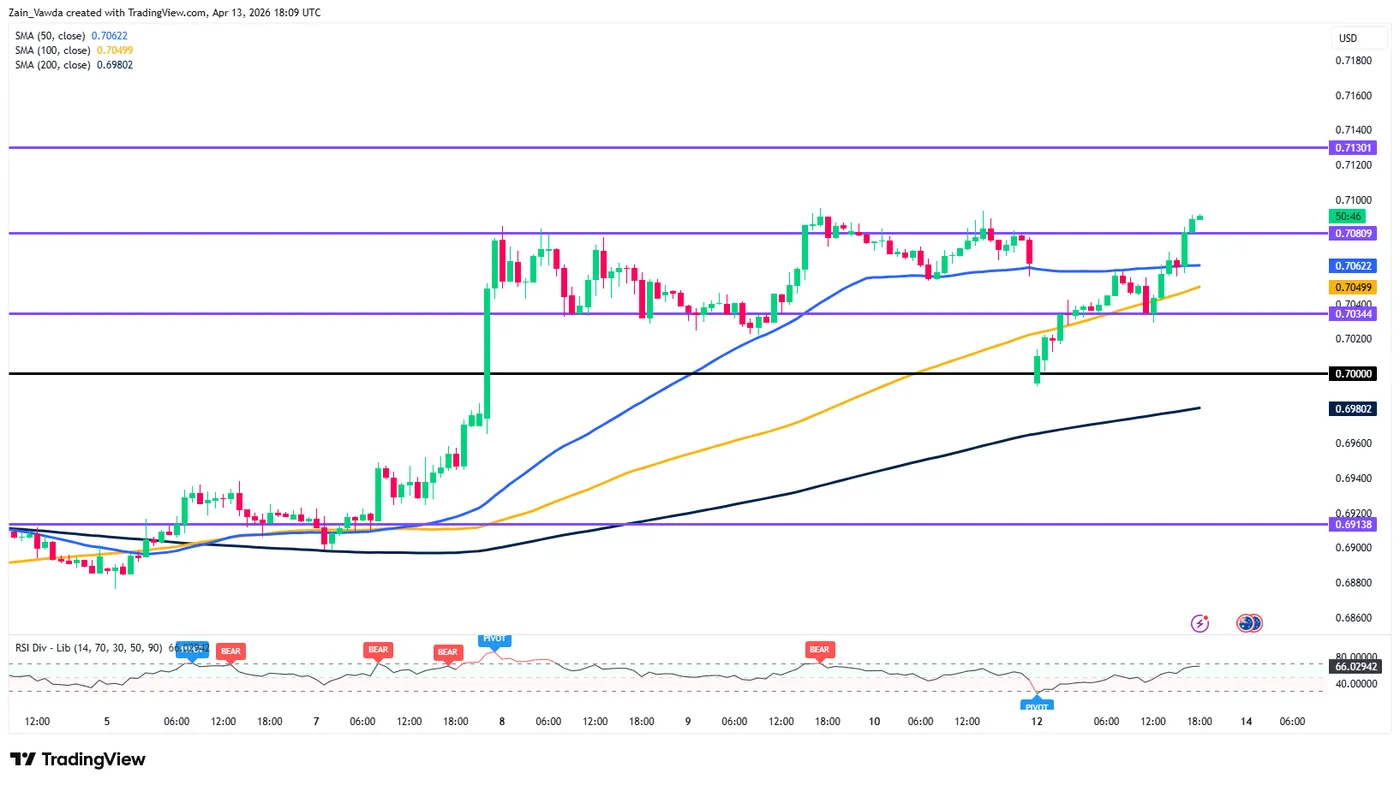
Source:TradingView.com
The RSI across multiple timeframes is not yet flashing “exhaustion” signals, though the Bearish Divergence labels on the H1 indicator suggest that the slope of the ascent might moderate. Traders should watch for a potential “throwback” to the 0.7034 area for a lower-risk entry if the current breakout stalls.
In short, the technical outlook for AUD/USD is decidedly bullish. The confluence of a trendline breakout on the Daily, a moving average crossover on the H4, and a range breakout on the H1 suggests that the path of least resistance remains to the upside. The 0.7130 level stands as the next major hurdle for the bulls.


