
- The overall bias for USD/CHF has turned decidedly bearish in the short to medium term following a significant rejection at the 0.80000 psychological handle.
- The pair is currently testing a critical support level at 0.78285, which is described as the “line in the sand” for bulls.
- Lower timeframes show extreme oversold readings on the RSI, hinting at a possible short-term corrective bounce toward resistance around 0.79000 before a potential continuation of the downside.
Daily Timeframe: Structural Shift at Key Resistance
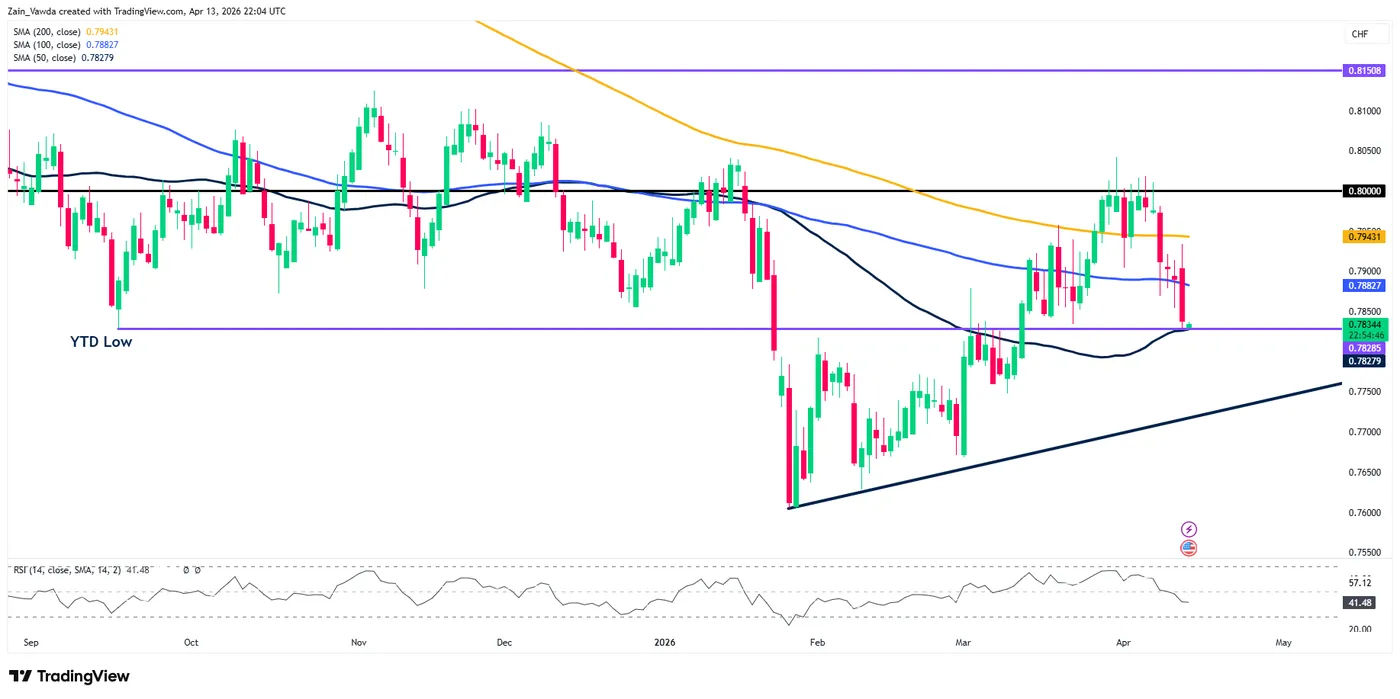
On the Daily chart, USD/CHF has faced a significant rejection at the 0.80000 psychological handle. This level has proven to be a formidable barrier, leading to a sharp reversal that has now brought the pair back down to a critical inflection point.
Trend Dynamics: The pair has been trending higher since early 2026, supported by an ascending trendline (dark navy). However, the recent price action shows a decisive break below the 200-day MA (yellow) and the 100-day MA (blue), signaling a shift in medium-term momentum.
Key Support/Resistance: We are currently testing the 0.78285 – 0.78344 support zone. This area aligns with previous structural pivots and is bolstered by the 200-day MA (black) sitting just above at 0.78279.
Indicator Outlook: The RSI is trending lower but has not yet reached oversold territory, suggesting there may be further room for the downside if the current support level fails to hold on a daily candle closing basis.
USD/CHF Daily Chart, April 13, 2026
Source: TradingView (click to enlarge)
H4 Timeframe: Momentum Accelerating Downward
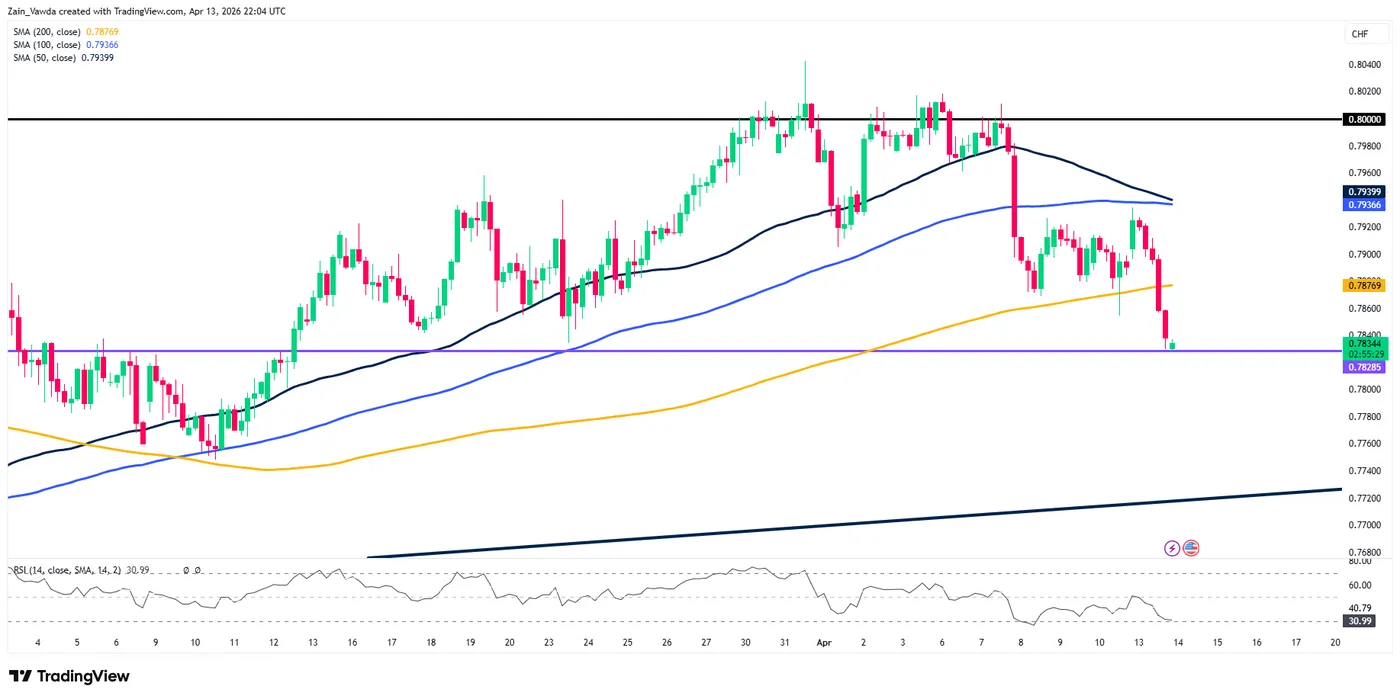
The H4 chart provides a clearer view of the recent “waterfall” sell-off. The bearish momentum accelerated once the pair lost the confluence of the moving averages near the 0.79400 region.
Moving Averages: The 50, 100, and 200 MAs are now fanning out above the current price, acting as dynamic resistance. The Death Cross (50 MA crossing below the 100/200 MA) is about to take place as well.
Price Action: We see a series of Lower Highs and Lower Lows. The current candle is hovering right at the 0.78285 horizontal support. A sustained break here would likely target the ascending trendline from the daily chart, currently located around the 0.77200 area.
RSI: On this timeframe, the RSI is deep in oversold territory (~30.99), which could hint at a short-term corrective bounce or consolidation before the next leg lower.
USD/CHF Four-Hour Chart, April 13, 2026
Source: TradingView (click to enlarge)
H1 Timeframe: Intraday Exhaustion?
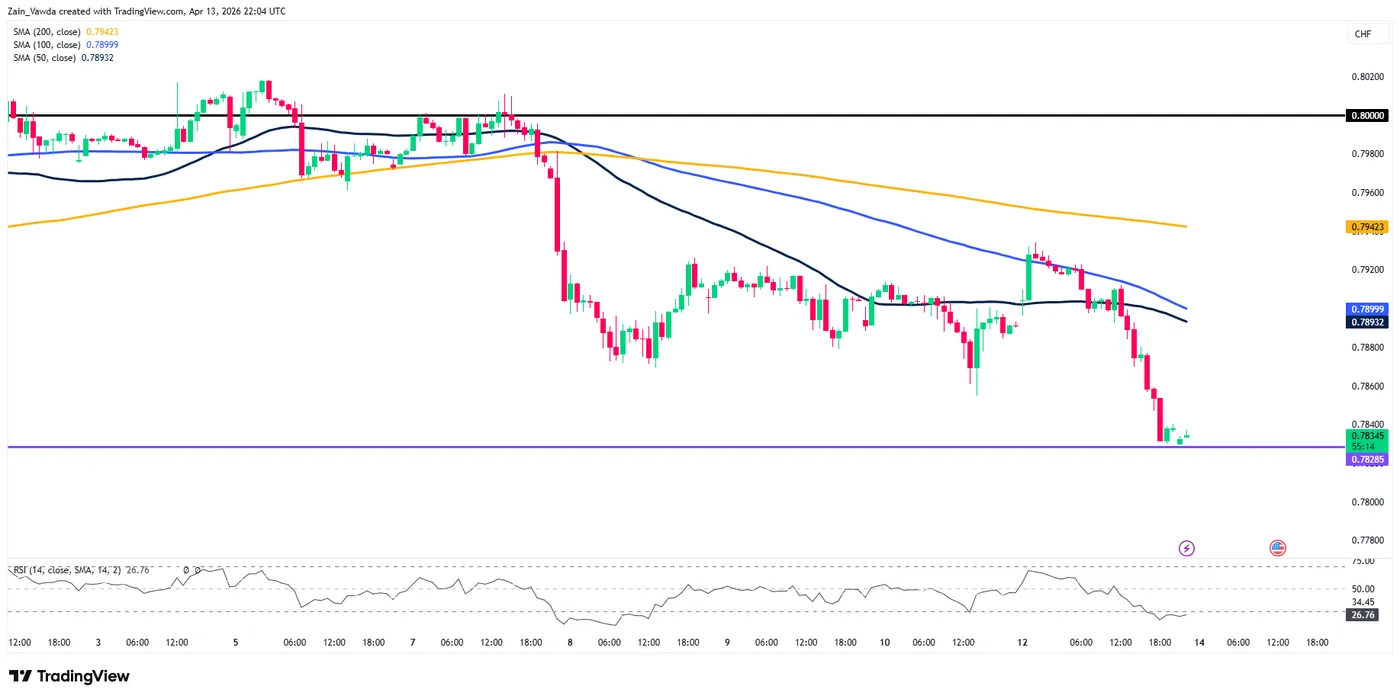
The hourly chart highlights the sheer velocity of the move during the April 13th session. The pair dropped nearly 100 pips in a straight line without a significant retracement.
Current State: The price is “hugging” the bottom of the range at 0.78345. Note the RSI on the H1 is at 26.76, indicating extreme intraday exhaustion.
Tactical Levels: * Immediate Resistance: If we see a “mean reversion” play, the first hurdle is the 0.78932 (50 MA) followed by the 0.79000 level.
Support: The 0.78285 level remains the “line in the sand” for bulls on an intraday and larger timeframe basis..
USD/CHF One-Hour Chart, April 13, 2026
Source: TradingView (click to enlarge)
Comprehensive Outlook
The overall bias for USD/CHF has turned decidedly bearish in the short to medium term following the failure at 0.80000.
Bullish Scenario: For the bulls to regain control, we need to see a strong rejection at the current 0.78285 support, followed by a daily close back above the cluster of moving averages at 0.79400.
Bearish Scenario: If the pair fails to hold 0.78285, the path of least resistance points toward the long-term ascending trendline near 0.77500 – 0.77200. Given the oversold RSI readings on the lower timeframes, a minor retracement to retest broken support (now resistance) at 0.79000 would offer a higher-probability entry for trend followers.
Key takeaway: Keep a close eye on the 0.78285 level; a daily candle close below this mark could trigger a fresh wave of selling toward the YTD lows.


