
- Bitcoin (BTC/USD) is currently battling resistance at the psychological 75000 level
- A clean close above 75000 is required for the bullish scenario to continue the rally toward targets at 76400 and 78197
- The bearish scenario is triggered if Bitcoin fails to hold the 50 MA (H1) at 74004, potentially leading to a drop to the 71673 support level
Bitcoin (BTC/USD) is currently locked in a tug-of-war at the psychological 75000 handle. After a volatile start to the month, the premier cryptocurrency has carved out a clear recovery path, though the technical indicators suggest the journey higher may require a brief pitstop.
Daily Chart: Structural Breakout and Moving Average Support
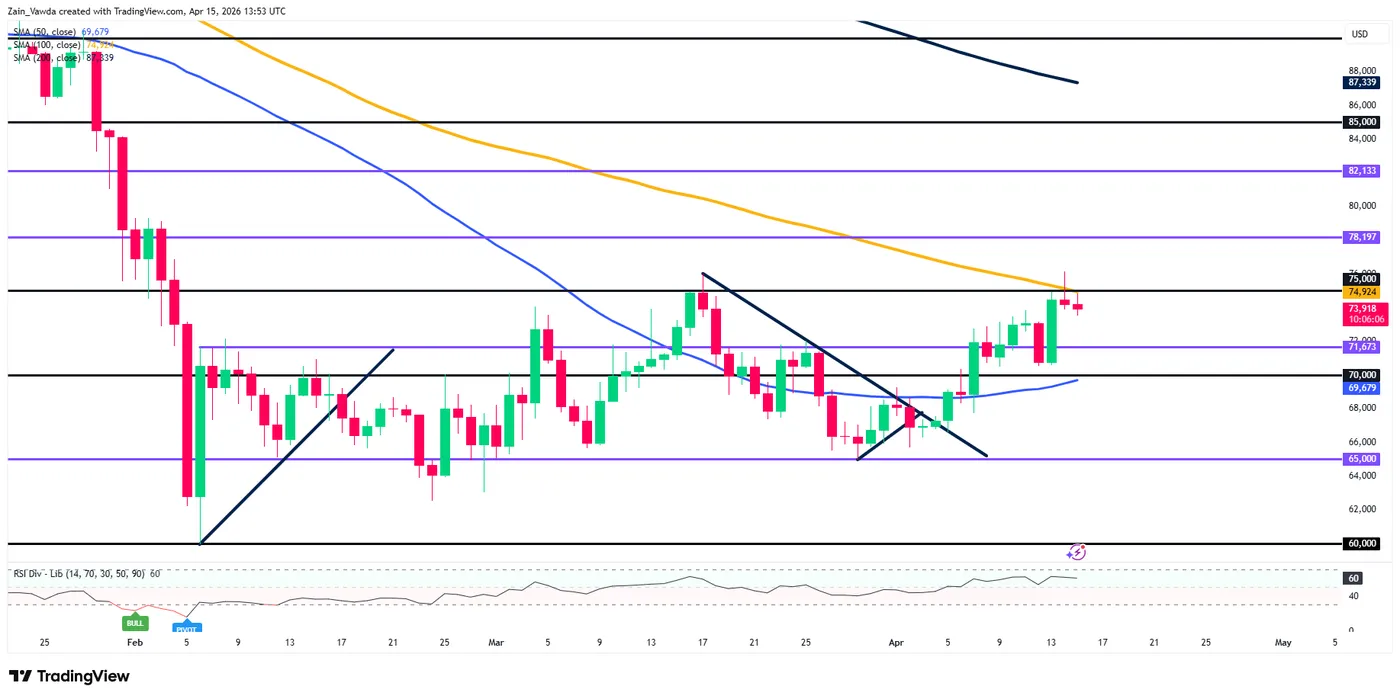
The daily timeframe paints a picture of a successful trend reversal. After enduring a period of downward pressure characterized by a descending channel, BTC has staged a convincing breakout.
Key technical highlights on the daily:
- The MA Cluster: Bitcoin has decisively reclaimed the 50-day MA (blue) at 69679 and the 200-day MA (black) at 87339 remains a long-term target. More importantly, it is currently testing the 100-day MA (yellow) at 74924 as immediate resistance.
- Support Base: The 70000 level has now transitioned from a daunting ceiling to a significant floor.
- RSI Momentum: The Daily RSI is sitting at 60, suggesting that while the trend is bullish, Bitcoin is far from “overheated”, leaving the door open for a run toward the 78197 and 82133 levels.
Bitcoin (BTC/USD) Daily Chart, April 15, 2026
Source: TradingView.com (click to enlarge)
H4 Chart: Consolidation Below the Ceiling
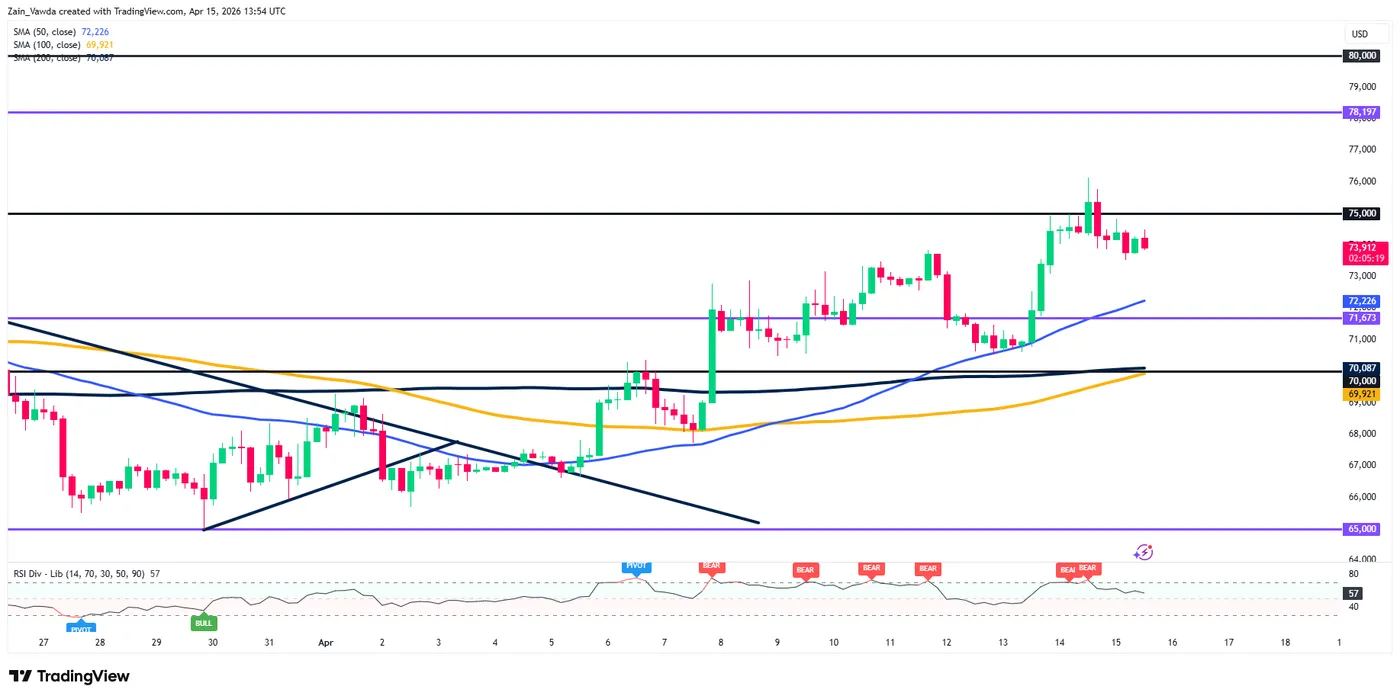
On the H4 chart, we can see the aggressive nature of the recent leg up. The pair surged from the 68000 zone, slicing through the 71673 level with significant volume.
However, price action has stalled over the last 24 hours just shy of the 75000 mark. We are seeing a series of “BEAR” labels on the RSI, which is currently at 57.
This cooling of momentum suggests that the market is waiting for a fresh fundamental catalyst or a period of consolidation before attempting to breach the year-to-date highs. The 50 MA (blue line) on the H4 is trending sharply upward, currently providing dynamic support at 72226.
Bitcoin (BTC/USD) Four-Hour Chart, April 15, 2026
Source: TradingView.com (click to enlarge)
H1 Chart: Scenarios for the Upcoming Session
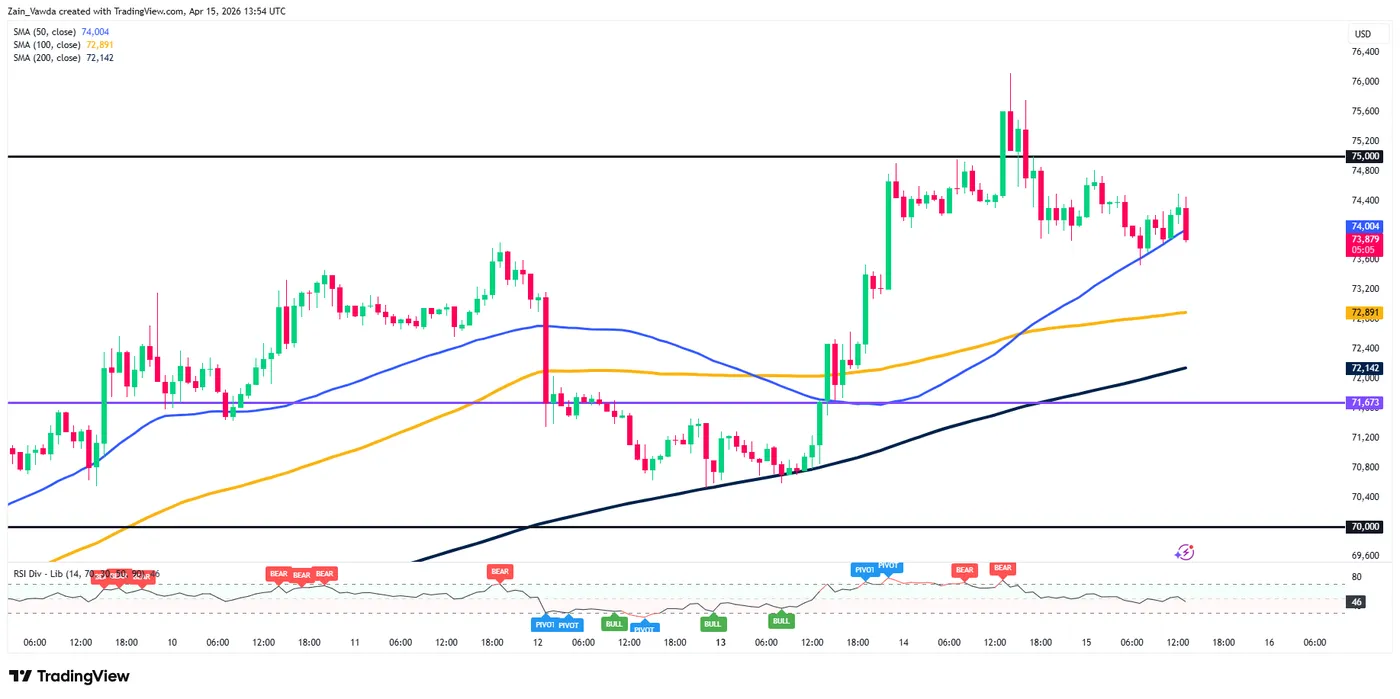
The hourly chart reveals the intraday sensitivity of Bitcoin as it trades within a narrowing range. Currently at 73918, the immediate direction will likely be determined by how price reacts to the ascending 50-day MA (blue) on this timeframe.
The Bullish Scenario
For a continuation of the rally, bulls need to defend the 73500 area. A clean hourly close above 75000 would likely trigger a wave of FOMO (fear of missing out), potentially catapulting the pair toward the next liquidity pocket at 76400 and eventually 78197.
The Bearish Scenario
The recurring “BEAR” pivot warnings on the H1 RSI cannot be ignored. If Bitcoin fails to hold the 50 MA (H1) at 74004, we could see a quick “flush” down to the 71673 support level. This would be a standard mean-reversion move to shake out late-entry long positions before a potential secondary attempt at the highs.
Key Levels to Watch:
- Resistance: 75000, 76400, 78197
- Support: 73500, 71673, 70000
Bitcoin (BTC/USD) One-Hour Chart, April 15, 2026
Source: TradingView.com (click to enlarge)
Bitcoin is in a “prove it” phase. While the macro structure is firmly bullish following the daily breakout, the 75000 level is proving to be a tough nut to crack. Patience may be the best tool for traders here looking for entries on a confirmed breakout or a deeper retest of support.


 is currently locked in a tug-of-war at the psychological 75000 handle. After a volatile start to the month, the premier cryptocurrency has carved out a clear recovery path, though the technical indicators suggest the journey higher may require a brief pitstop.)