
Key takeaways
DJIA lagging but poised for catch-up: While other major US indices have posted gains post ceasefire, the Dow has underperformed but is now showing signs of a bullish catch-up above key support at 47,895.
Macro tailwind improving for financials: Stabilisation and potential re-steepening of the US yield curve could boost bank profitability, supporting the Dow given its heavy financial sector weighting.
Bullish technical structure forming: The DJIA is in a minor uptrend within an ascending channel; a break above 48,850 may extend gains toward 49,715/49,835, while failure risks a pullback toward 47,460.
Since the start of the ongoing recovery seen in the risk assets, such as global equities, last Wednesday, 8 February 2026, on the backdrop of the US-Iran ceasefire agreement, which put a pause to the seven-week war, the Dow Jones Industrial Average (DJIA) has lagged behind the other three major US stock indices with a current loss of 0.8% from pre-war baseline on 27 February 2026 to Thursday, 16 April 2026.
In contrast, gains were recorded in the S&P 500 (+2.4%), small caps Russell 2000 (+3.3%), and the top performer, the higher beta technology heavyweight, Nasdaq 100 (+5.5%) (see Fig. 1).
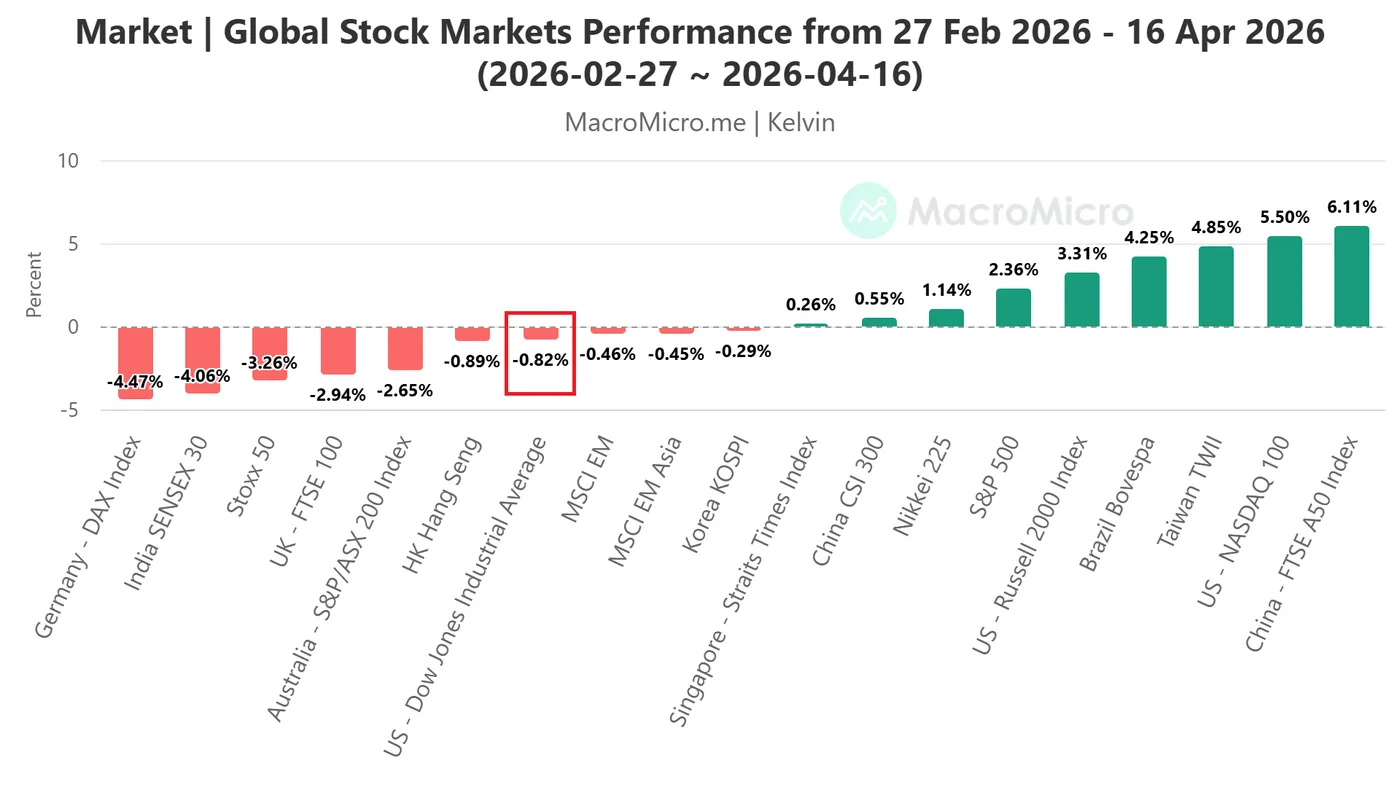
Fig. 1: Global benchmark stock indices performances from 27 Feb 2026 to 16 Apr 2026 (Source: MacroMicro).
The US Treasury yield curve bear flattening has reached a plateau
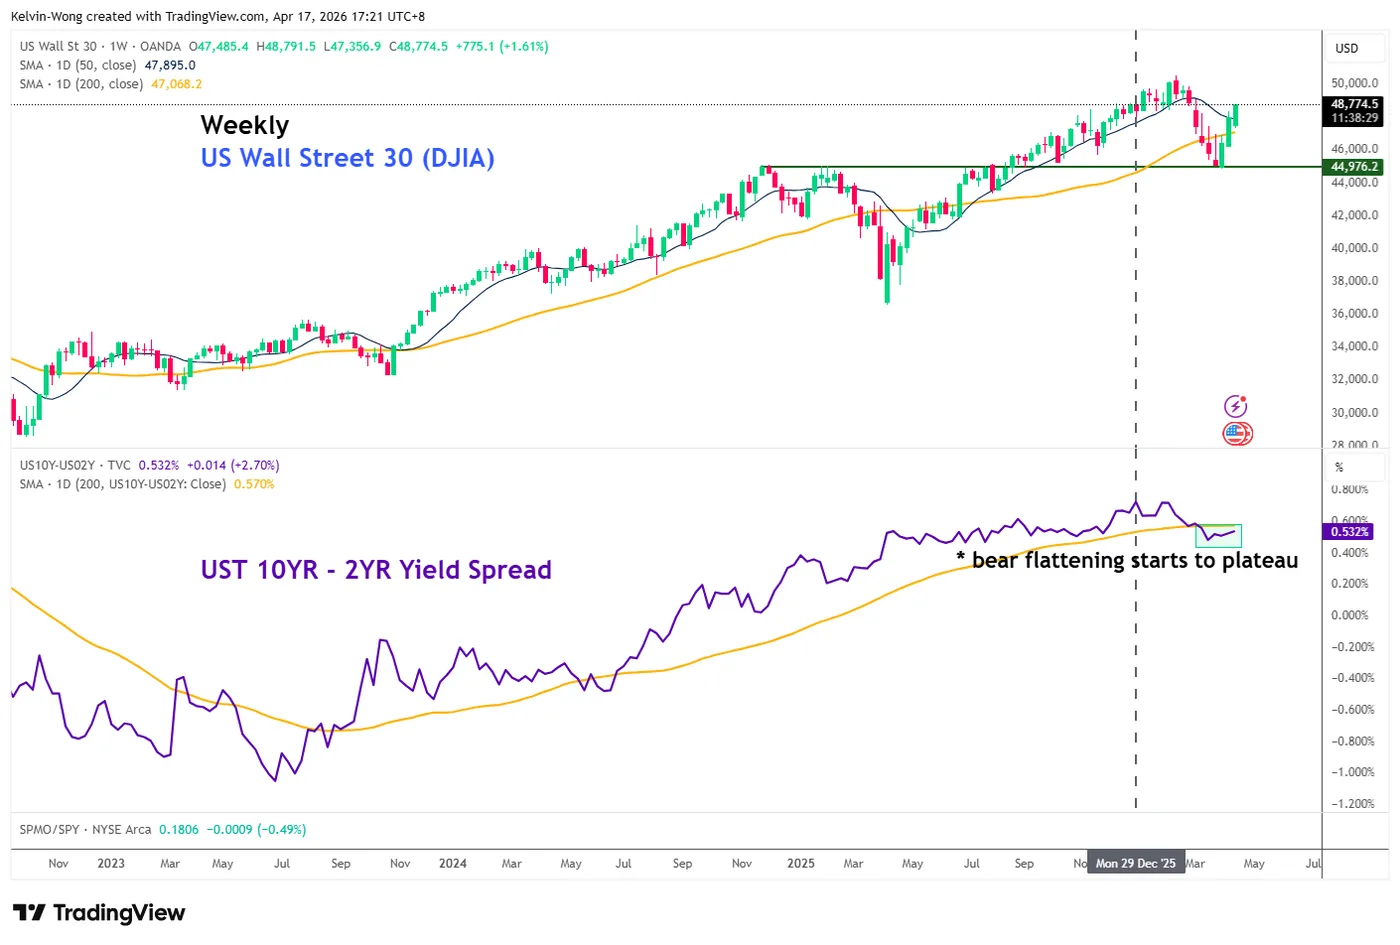
Fig. 2: US Treasury yield curve (10-YR minus 2-YR) major trend as of 17 Apr 2026 (Source: TradingView).
The Financials sector is the top sector in the DJIA, with a weightage of around 27%, and Goldman Sachs is the top price-weighted component stock in the DJIA with a weight of 11.4% as of Thursday, 17 April 2026.
The underperformance of the Dow Jones Industrial Average has been underpinned by bear flattening of the US Treasury yield curve (10-year minus 2-year), where the yield spread dropped by 11 basis points (bps) to hit an eight-month low of 0.48% on the week of 16 March 2026; such a shift typically signals tighter financial conditions, which can weigh on economic growth and pressure bank profitability.
In the past five trading sessions, stagflation risk arising from a prolonged period of global oil supply crunch has eased, in turn, reducing the odds of a hawkish monetary policy guidance from the US Federal Reserve.
Hence, the 4 weeks of bear flattening movement seen in the US Treasury yield curve have started to plateau as the yield spread has increased by 5 bps to 0.53% at the time of writing (see Fig. 2).
A bull re-steepening in the US Treasury yield curve is likely to improve the earnings prospects of banks, in turn, triggering a positive feedback loop into the Dow Jones Industrial Average.
Let’s now decipher the short-term trajectory (1 to 3 days) of the US Wall Street 30 CFD index and its supporting elements from a technical analysis perspective.
Dow Jones (DJIA) – Minor bullish trend from 30 March 2026 low remains intact
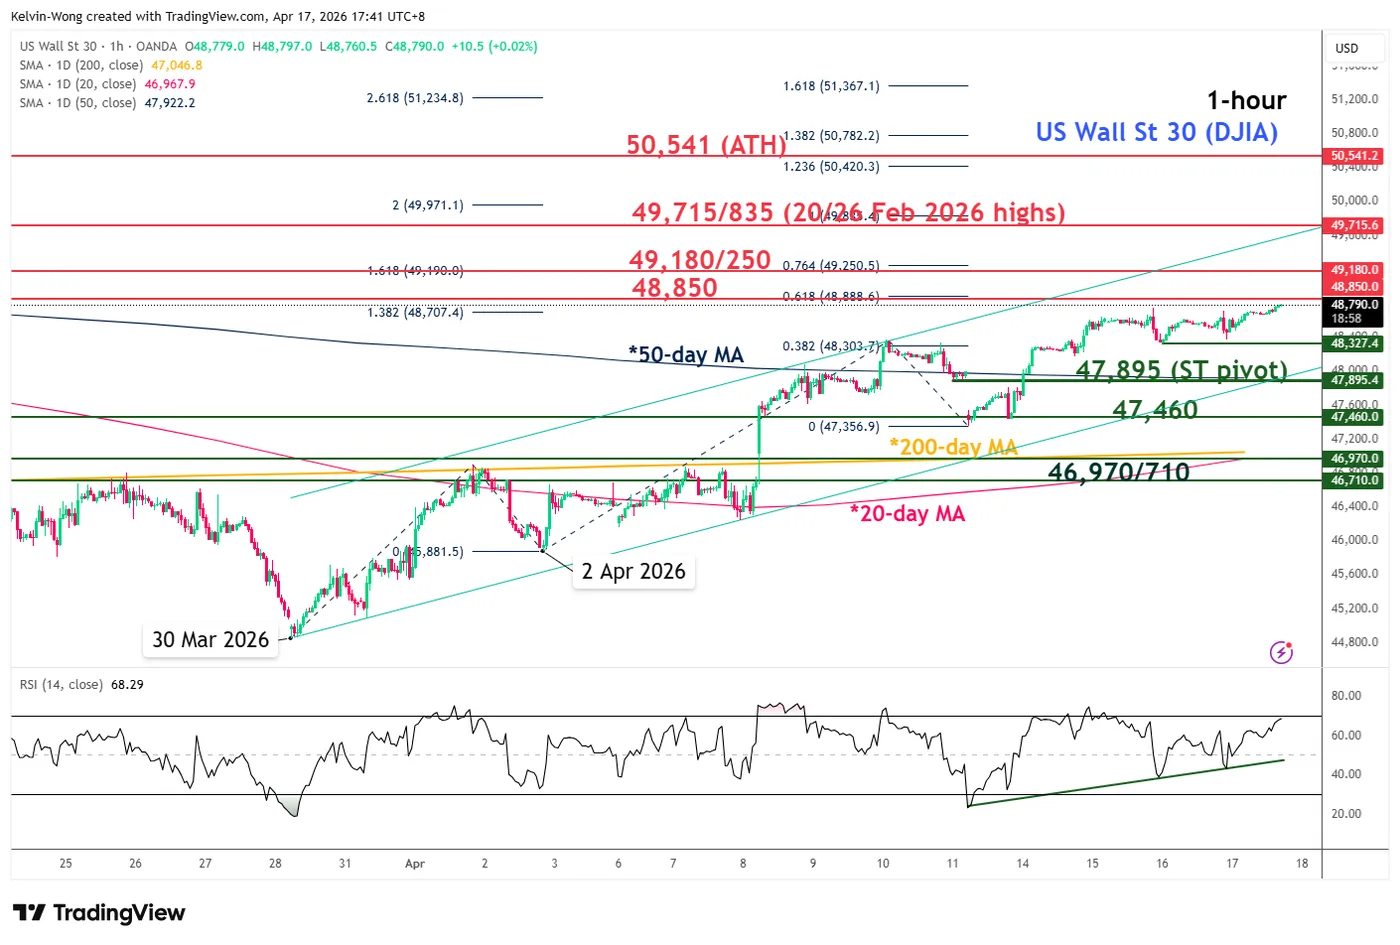
Fig. 3: US Wall Street 30 CFD index minor trend as of 17 Apr 2026 (Source: TradingView).
Watch the 47,895 key short-term pivotal support on the US Wall Street 30 CFD index (a proxy of the Dow Jones Industrial Average E-mini futures).
A clearance above the 48,850 near-term resistance increases the odds of the continuation of the bullish impulsive up move sequence for the next intermediate resistances to come in at 49,180/49,250 and 49,715/49,835 (see Fig. 3).
On the other hand, failure to hold at 48,850 with an hourly close below it negates the bullish tone for a minor corrective decline towards the next immediate supports at 47,460 and 46,970/46,710 (the area around the intersection of the 20-day and 200-day moving averages impending bullish crossover).
Key elements to support the near-term bullish bias on Dow Jones (DJIA)
- Price actions started to oscillate within a minor ascending channel from the 30 March 2026 low and traded above all three moving averages (20-day, 50-day, and 200-day).
- The hourly RSI momentum index has managed to stage a rebound after a retest on its ascending support on Thursday, 16 April 2026, at the 43 level.
- Elliot Wave Theory suggests the recent rally from the 2 April 2026 low of 45,882 is likely considered as a minor bullish impulsive wave three structure with its potential terminal zone at 49,715/49,835 (1.00 Fibonacci extension from the 2 April 2026 low and the upper boundary of the minor ascending channel).


