
- Silver and Gold are bouncing higher again after the Federal Reserve and other Central bank meetings
- With Oil and the US Dollar stumbling on the session, Metals and other risk assets are shining bright
- Intraday timeframe analysis for XAG/USD and XAU/USD
Silver and Gold are bouncing higher in today’s session, with the bid taking traction in the wake of the Federal Reserve and a barrage of other global central bank meetings; With both Crude Oil and the US Dollar stumbling during today’s session, precious metals and broader risk assets are shining bright again.
For weeks if not months, metals have been trapped in a truly bizarre, choppy range.
Despite numerous attempts, bulls have been completely unable to gather sustained upside momentum – This came along with a lack of real safe-haven demand, and the questioning on whether metals are still valuable at current valuations for flights towards quality.
Yet, every sharp pullback has seen sharp response, preventing any clear technical downtrend.
This erratic, sideways price action points to deep, fundamental confusion among institutional investors.
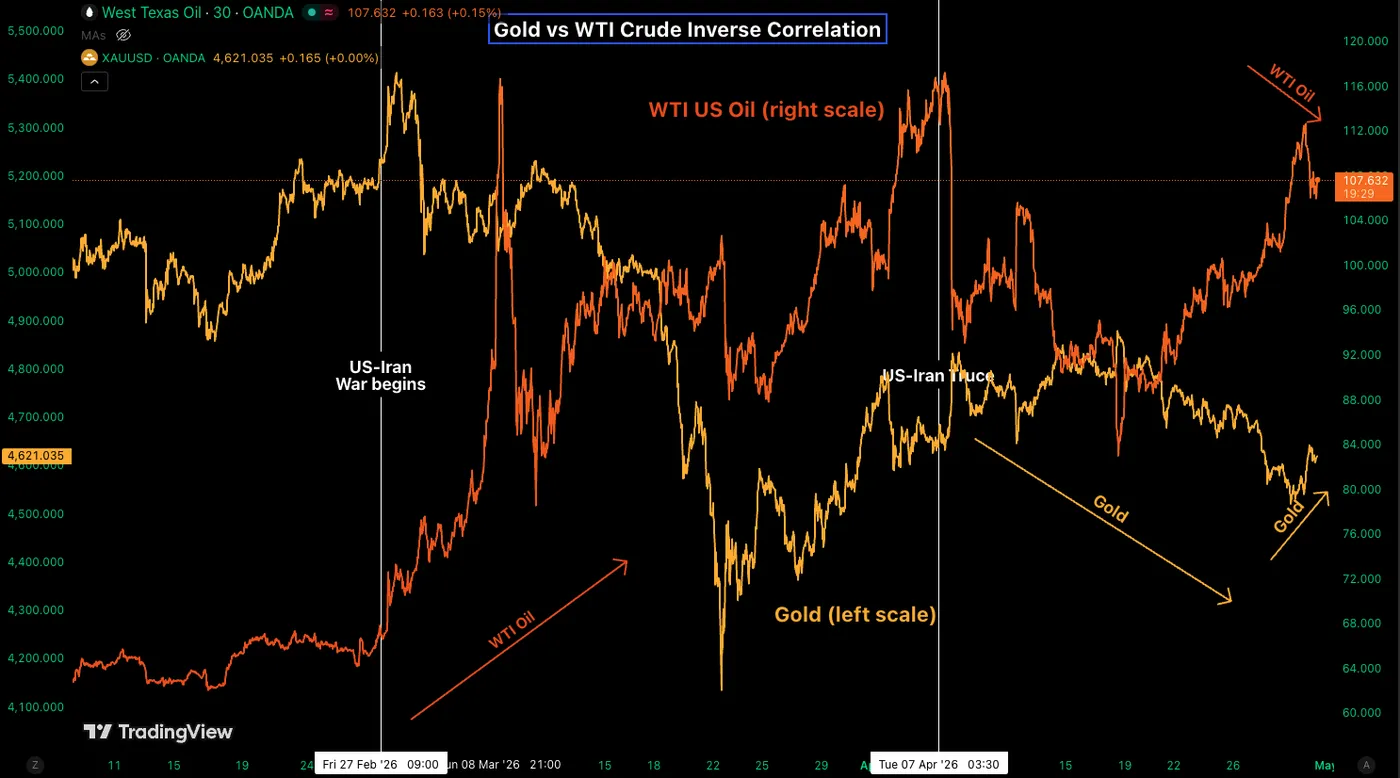
Gold vs WTI Crude Inverse Correlation – Source: TradingView. April 30, 2026
This widespread Market confusion is quite logical.
The macroeconomic and geopolitical backdrop remains both uncertain and chaotic.
High-stakes US-Iran diplomatic talks are completely stuck in the mud, with President Trump explicitly indicating that he does not mind maintaining the aggressive maritime blockade indefinitely to keep a relentless chokehold on the Iranian economy – Israel and Pakistan are also sending their own conflicting reports.
Meanwhile, global central banks remain highly reluctant to change their defensive policy stances amid this unpredictable environment.
As long as Crude Oil remains structurally elevated (above $80), precious metals—which are highly sensitive to the threat of stickier, energy-driven inflation and the resulting higher for longer rate pricing—will continue to face overhead pressure.
However, it will be incredibly interesting to see how these assets react if the Middle East conflict actually reaches a proper diplomatic resolution.
For now, the intraday rallies in Gold and Silver are almost entirely explicable on the broad-based drop in the US Dollar. If this Greenback weakness gains further structural traction, particularly if the conflict resolves, a clean, aggressive rally could easily follow.
Bulls should have their eyes firmly set on some upside targets for longer-run breakouts, looking at the $4,900 level for Gold and $84 for Silver.
Let’s explore the recent shifts in an intraday timeframe analysis of Gold (XAU/USD) and Silver (XAG/USD) to identify where are the key levels to watch for breakouts.
Gold (XAU/USD) 4H Chart and levels
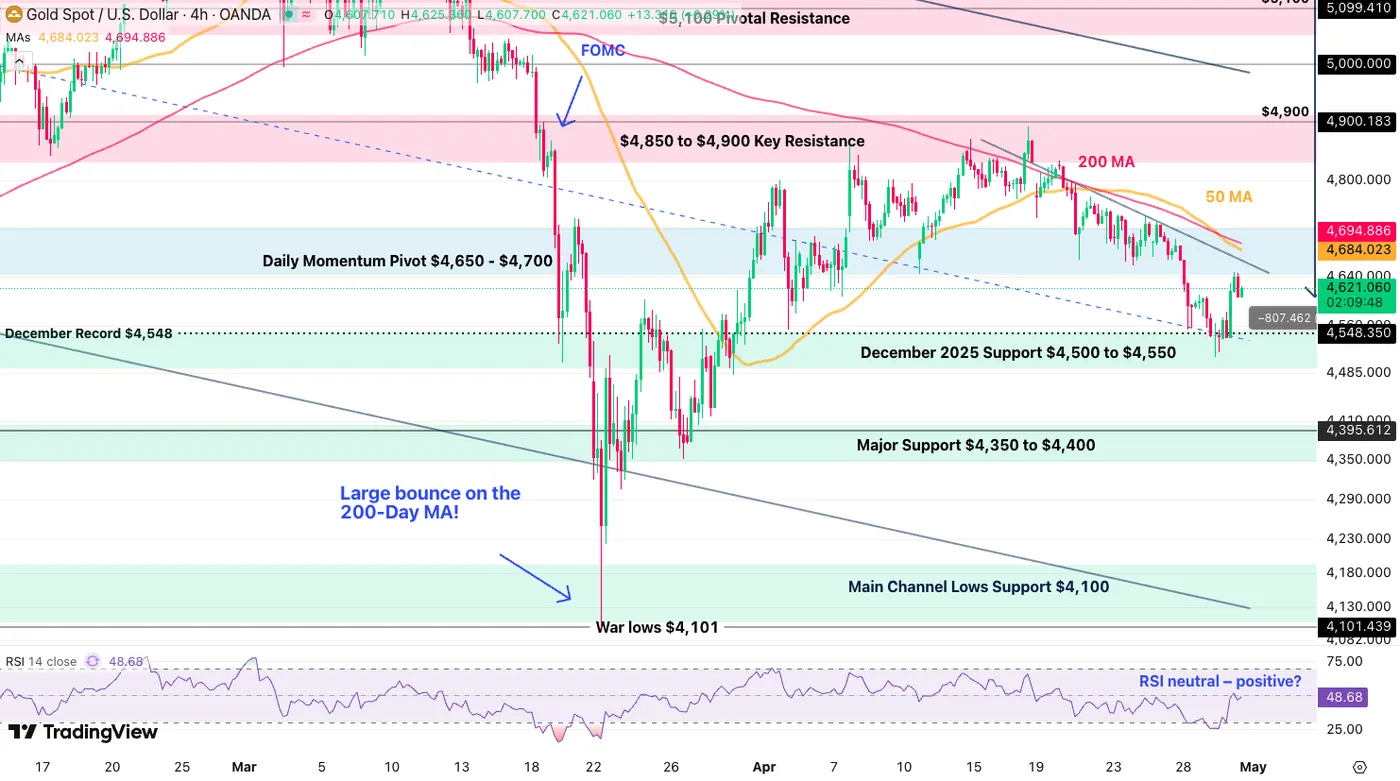
Gold (XAU/USD) 4H Chart, April 30, 2026 – Source: TradingView
After bouncing from its $4,500 Support (near the 2025 December record), the price action is much less bearish but also not so bullish yet. This confirms with the neutral RSI.
In such price action, it is favorable for traders to let prices form the trades:
- For bulls, wait for an extension above $4,700, breaking above the 50 and 200 Moving Averages (stop orders could be valid)
- Bears will want to see a reversal around current levels or rejecting the 50 MA ($4,685) with further acceleration below $4,485 (wait for a rejection of the MA before entering)
Intraday Timeframe Levels to watch for Gold (XAU/USD):
Resistance Levels:
- $4,685 – 4,700 4H 50 & 200 MA
- $4,850 to $4,900 Major Resistance (bullish above)
- $5,100 Pivotal Resistance
- $5,400 mini-resistance
Support Levels:
- December 2025 Support $4,500 to $4,550 (bearish below)
- Pivotal Support $4,325 – $4,400
- Main Channel Lows Support $4,100
- Next Support $3,880 to $4,000
Silver (XAG/USD) 4H Chart and levels
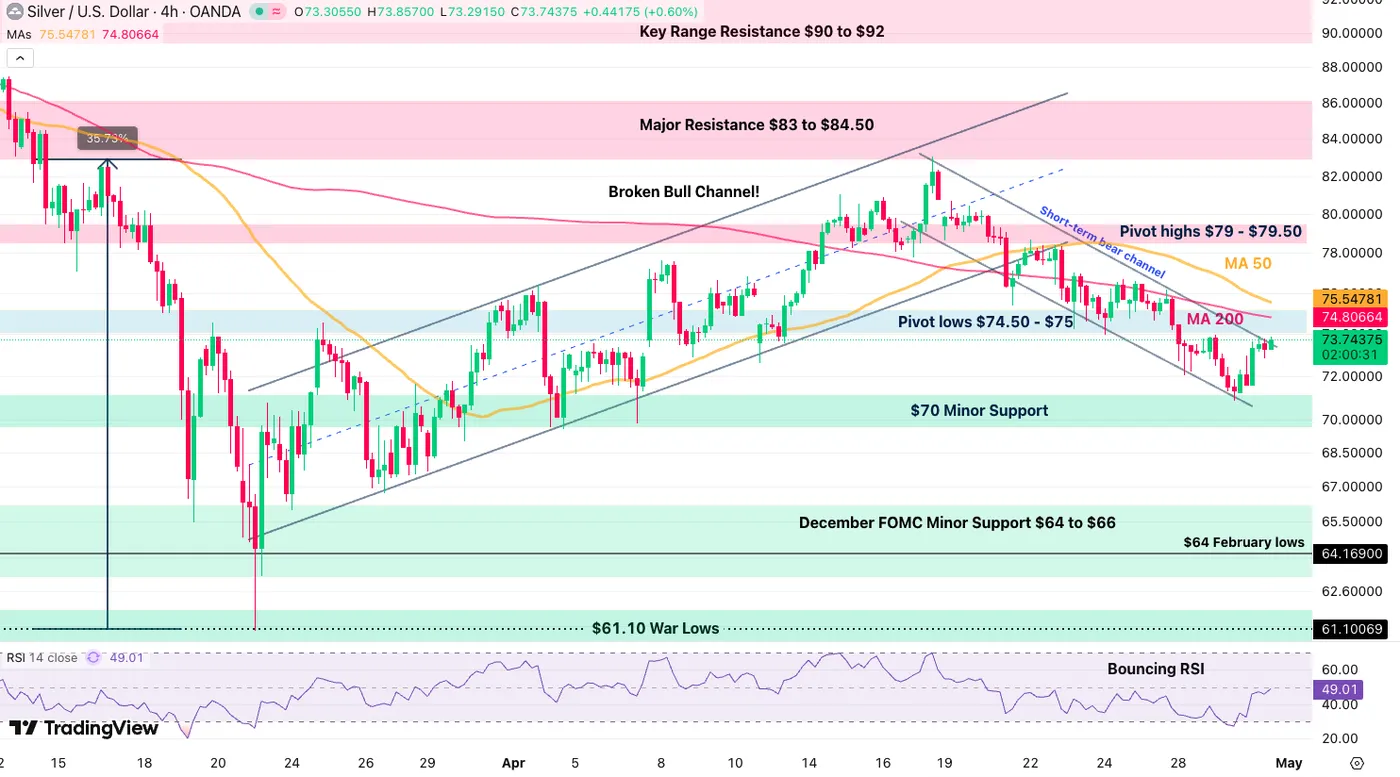
Silver (XAG/USD) 4H Chart, April 30, 2026 – Source: TradingView
Silver bulls have found strong support just above $70 and are testing the upper bound of the bear-channel.
Not far above, the action will meet the 4H 200-period MA ($74.80).
- Extending above should relaunch odds of a continued bounce towards $84.
- Above $84, the action is back to in much more bullish territory.
- Rejecting between here and the 200-MA (~$74), bears will regain the upper hand and add to their chances to create a more meaningful correction in the metal.
- Breaking $61 should see heavy continuation to the downside.
Higher Timeframe Levels to watch for Silver (XAG/USD):
Resistance Levels:
- Pivot lows $74.50 – $75 (4H 200-period MA – bullish above)
- Pivot highs $79 – $79.50
- $84 Major level
- Key Range Resistance $90 to $92
- $96.47 March highs (higher odds of All-time highs if break above)
- Current Record $121.67
Support Levels:
- $70 – $72 Minor Support (recent bounce – Bearish below)
- December FOMC Minor Support $64 to $66
- $61.10 Past Session lows
- $50 to $55 October Resistance now Major Support
- Silver’s 2011 All-time highs $49.81
Safe Trades and good luck for next month!


