
Natural Gas: ⬇️ Sell
– Natural Gas reversed from resistance zone
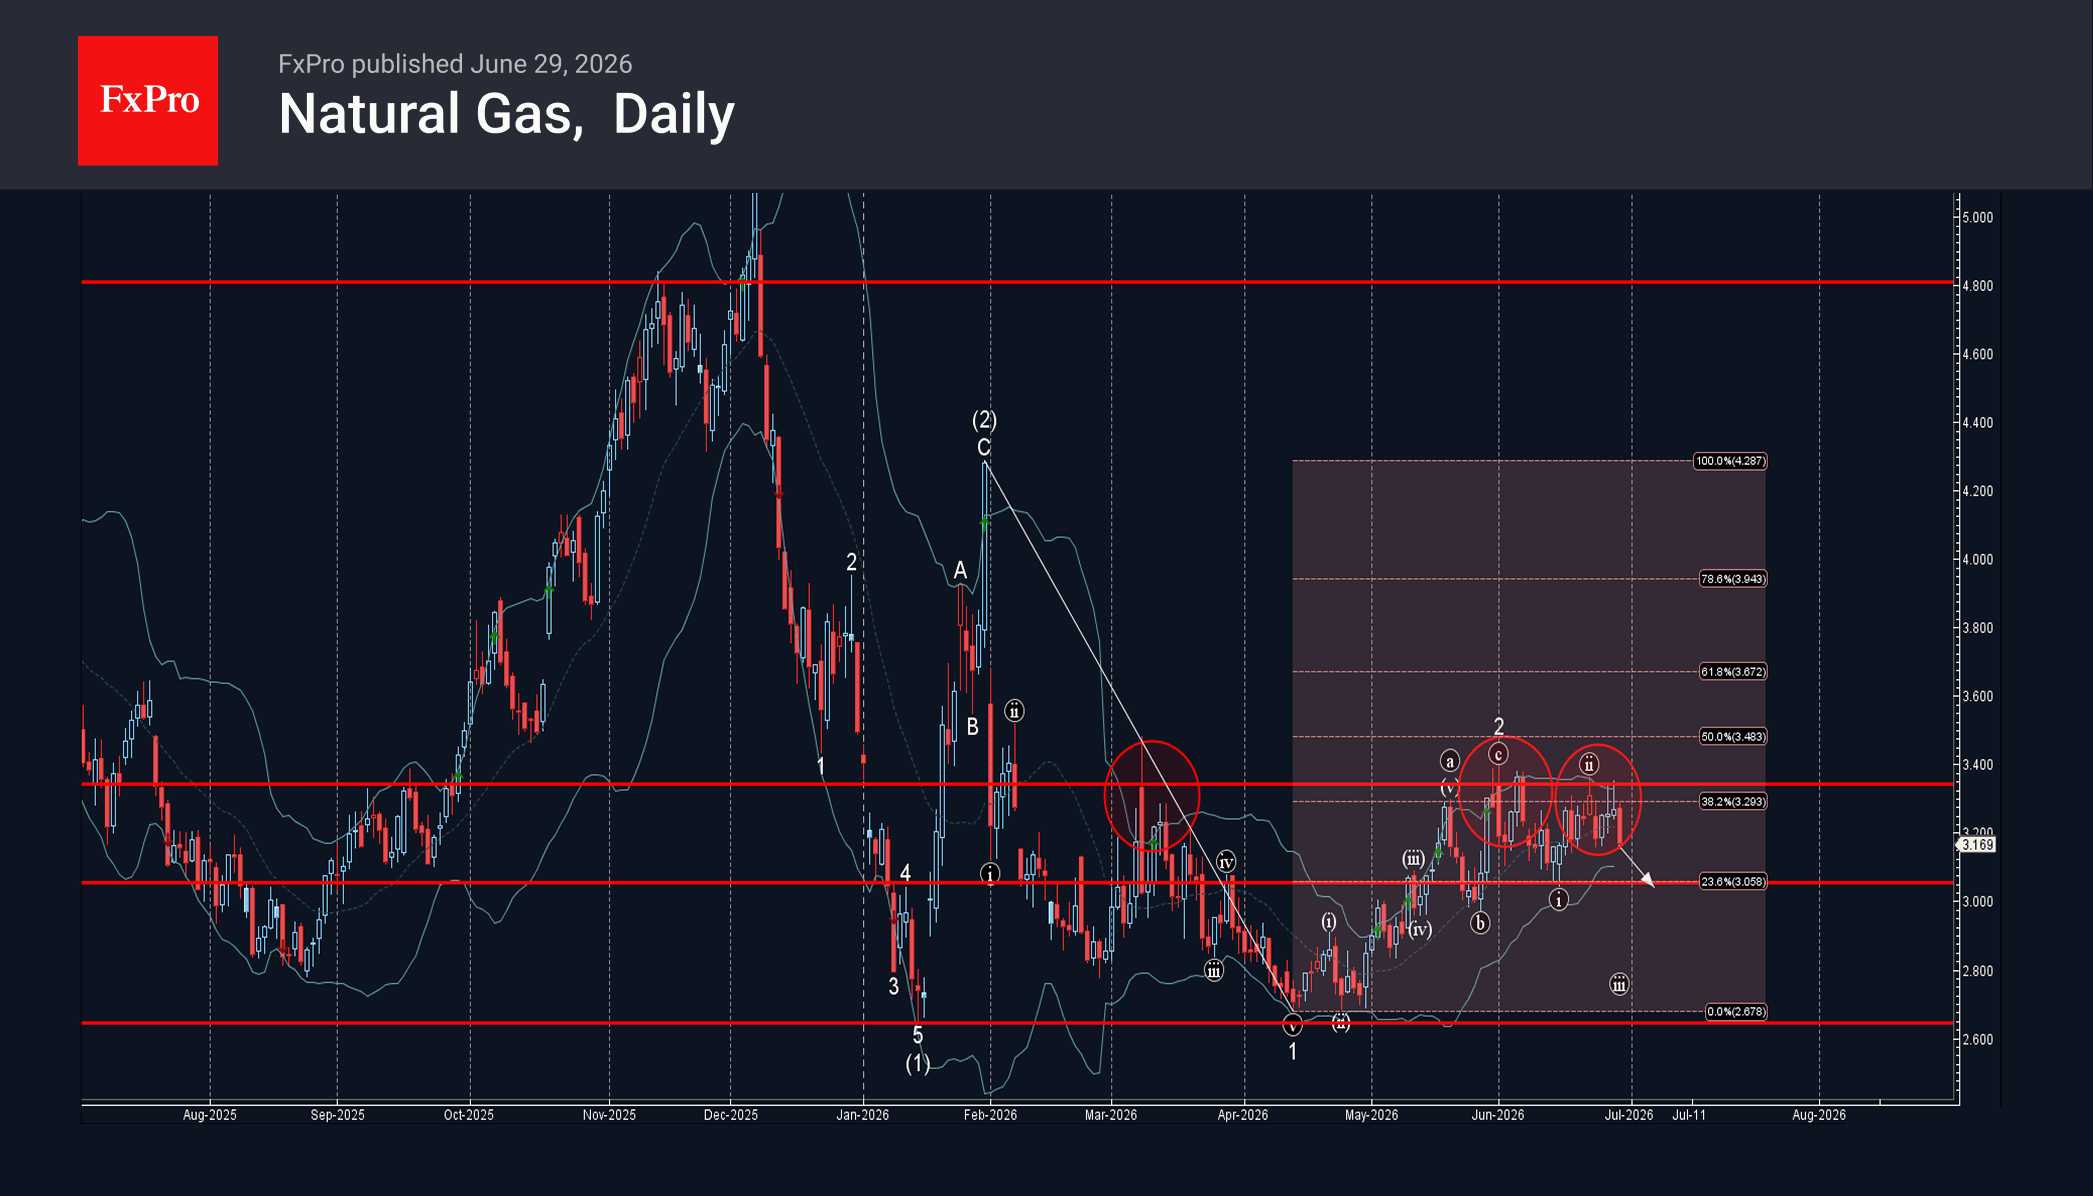
– Likely to fall to support level 3.055
Natural Gas recently reversed from the resistance zone between the pivotal resistance level 3.34 (which has been reversing the price from March), 38.2% Fibonacci correction of the downward impulse from January and the upper daily Bollinger Band.
The downward reversal from this resistance zone is likely to form the daily Japanese candlesticks reversal pattern Evening Star.
Given the clear daily downtrend, Natural Gas can be expected to fall to the next support level 3.055 (low of the previous minor impulse wave i).


, 38.2% Fibonacci correction of the downward impulse from January and the upper daily Bollinger Band.)