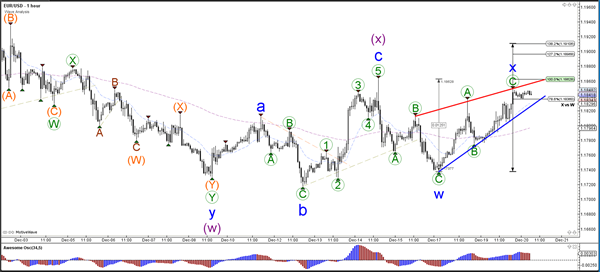
Currency pair EUR/USD
The EUR/USD break below the 100% Fib level of wave 2 vs 1 invalidates the wave 2 (pink) and indicates an expansion of wave 4 (light purple). It needs to break the support or resistance trend line before the short-term direction becomes clear.
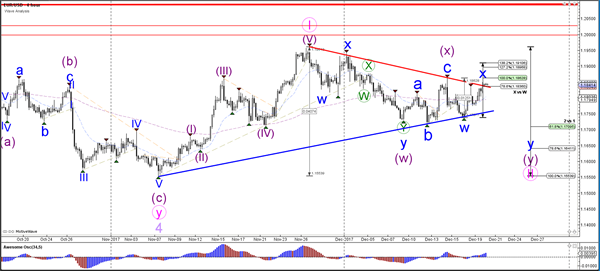
The EUR/USD could still be in a wave X (blue) as long as price stays below the 138.2% Fibonacci level of wave X vs W. Price is probably completing a rising wedge chart pattern (red/blue lines) within wave X (blue).
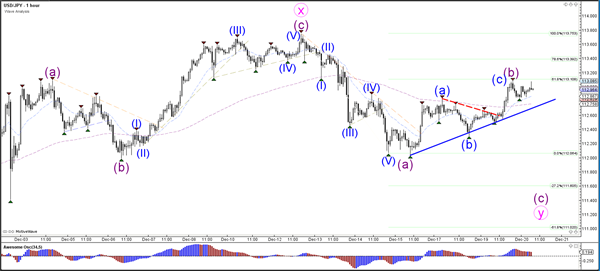
Currency pair USD/JPY
The USD/JPY broke above the resistance (dotted red) of the triangle pattern and is now challenging the 61.8% Fibonacci resistance level of wave B (purple). A bearish bounce could see price fall towards the Fib levels of wave 2 or B.
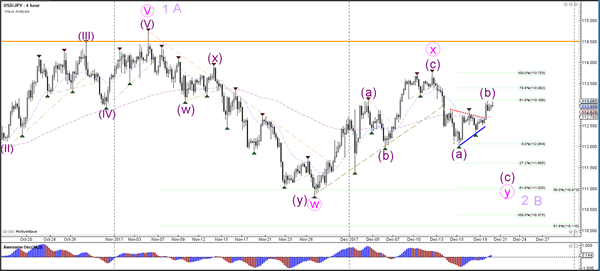
A break above the 100% level at 113.75 would invalidate the ABC zigzag (purple).
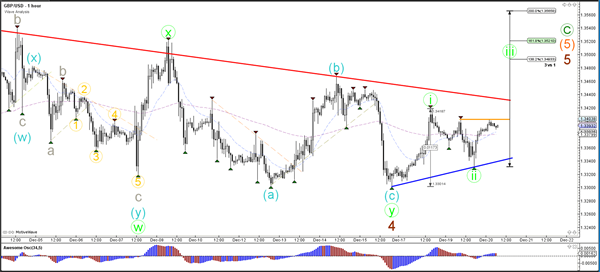
Currency pair GBP/USD
The GBP/USD support and resistance trend line could be a large bull flag chart pattern. A bullish breakout could confirm the pattern and a wave 5 of wave C.
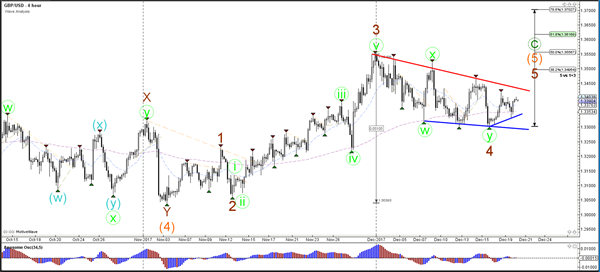
The GBP/USD seems to be building a potential wave 1-2 (green) pattern.