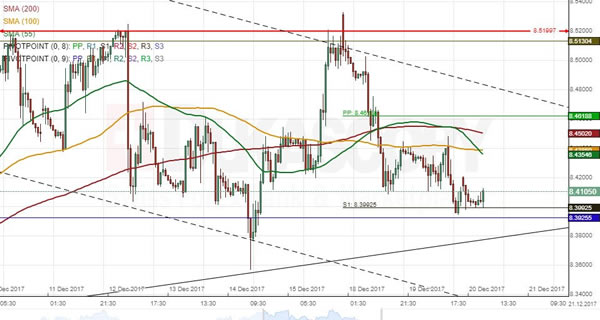
USD/SEK had been guided by a channel down valid since November, 2016. This long-term pattern was eventually breached to the upside two months ago when a junior channel proved to be stronger. The rate has since diminished its trading range in the given pattern, thus failing to reach its lower boundary on November 27. Meanwhile, a possible surge north has been halted by the 8.52 area on several occasions. Technical indicators suggest that the US Dollar is likely to edge higher in this session. Given the strong resistance of the 100-, 55– and 200-hour SMAs and the weekly PP, any attempts to move past the 8.4520 mark should be disrupted. Subsequently, the pair could either trade sideways for some period prior to falling down or do the latter right away. A possible downside target for the following three weeks is the 8.32 area.