


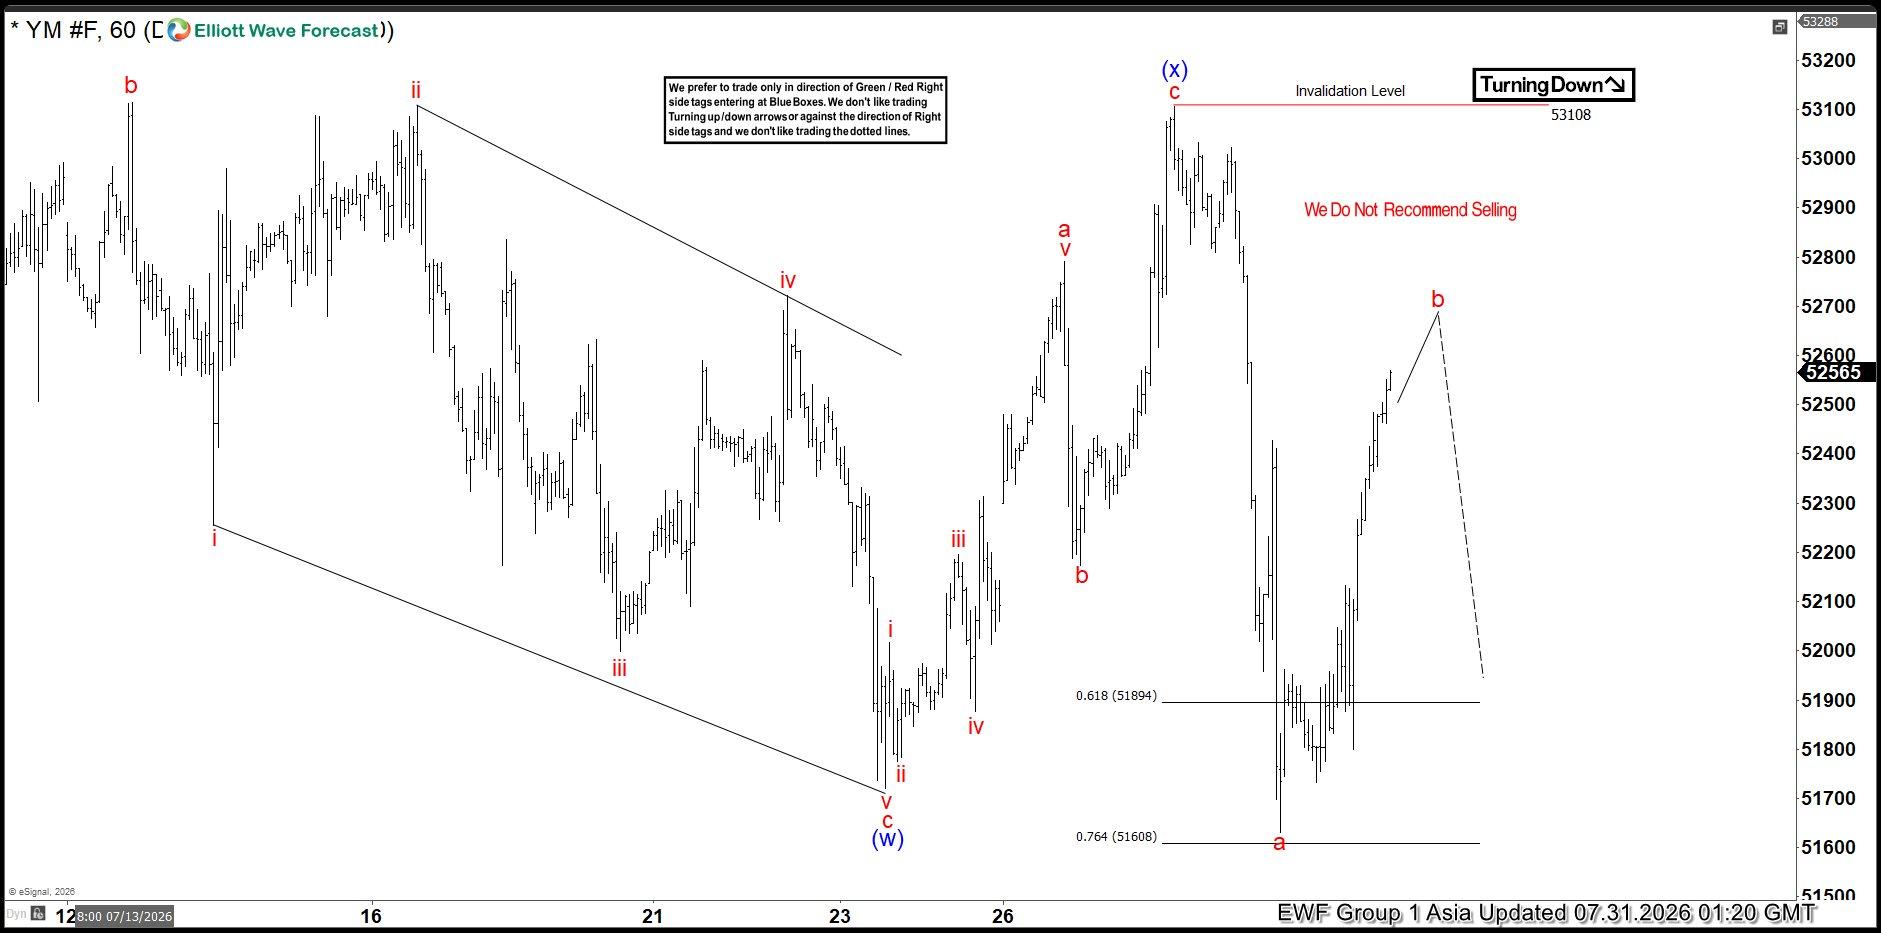
Dow Jones Futures (YM) is pulling back to correct the cycle from the 45,430 low in wave 2. The Elliott Wave structure suggests that the index remains vulnerable to further downside in the near term, as long as it stays below the 53,105 high. The decline from the peak completed three swings within wave (w), followed by a corrective bounce in wave (x). This bounce ended at 53,105, and YM has since turned lower again. The current structure suggests that the index is developing another five-wave decline in wave (y), which could complete the larger wave 2 correction.
We expect wave (y) to extend toward the 51,182–49,991 area. This zone represents the 100%–161.8% Fibonacci extension of wave (w) and could provide an important area for the next reaction. How YM responds there will help determine whether the entire wave 2 pullback has ended or whether the current decline represents only part of a larger correction.
In the next 24 hours, we expect any bounce to fail in 3, 7 or 11 swings to continue downside while remaining below 53,105. However, the wave 2 pullback still appears relatively shallow compared with the previous advance from 45,430. Therefore, there is a possibility that the correction could extend further and develop into a larger 7- or 11-swing structure.
For now, the near-term bias remains lower, with 51,182–49,991 serving as the key zone to watch for signs of support and a potential change in structure.
YM #F 60 Min. Elliott Wave Chart
Dow Jones Futures (YM) Video Analysis
You are currently viewing a placeholder content from Default. To access the actual content, click the button below. Please note that doing so will share data with third-party providers.





 is pulling back to correct the cycle from the 45,430 low in wave 2. The Elliott Wave structure suggests that the index remains...)