


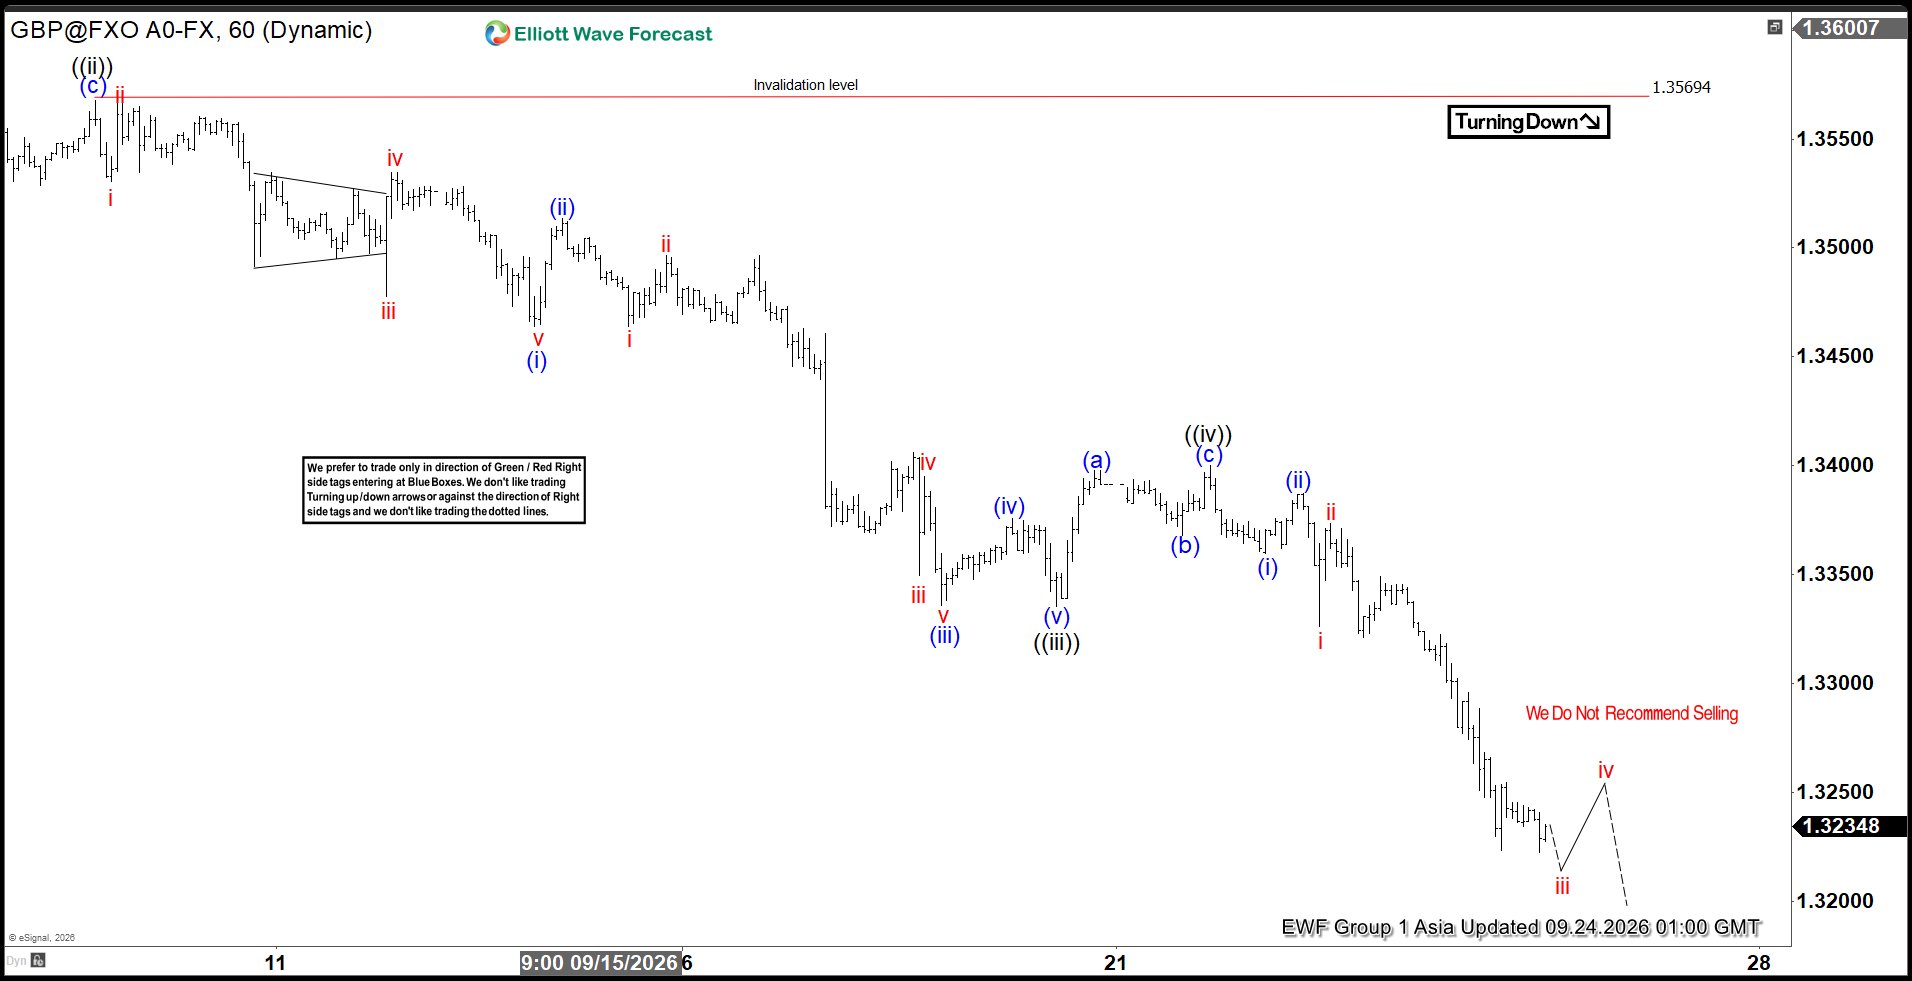
GBPUSD continues to unfold a short‑term decline from the August 21, 2026 high, developing as a five‑wave impulse. From that peak, wave ((i)) concluded at 1.3474, followed by a corrective rally in wave ((ii)) that ended at 1.3569. The pair then resumed lower in wave ((iii)), reaching 1.3335, before a modest rally in wave ((iv)) concluded at 1.34. Price action now suggests that wave ((v)) is nearing completion, which should finalize the cycle from the August 21 high. Once this impulse ends, the pair is expected to stage a three‑wave corrective rally to retrace the decline before resuming its broader bearish trend.
The technical picture becomes more compelling if GBPUSD breaks below the June 24, 2026 low at 1.314. Such a move would confirm five swings down from the August 21 high, reinforcing the view of a double three corrective structure labeled (W)‑(X)‑(Y). This development would favor further downside and open the path toward an extended target zone. The extreme area is defined by the 100% to 161.8% Fibonacci extension of wave (W), which projects into the 1.249 to 1.294 region. This zone represents the next critical support cluster and should attract significant market attention. The overall sequence highlights the persistence of bearish momentum. Corrective rallies likely to fail and give way to renewed weakness.
GBPUSD 60 Minute Elliott Wave Chart
GBPUSD Elliott Wave Video
You are currently viewing a placeholder content from Default. To access the actual content, click the button below. Please note that doing so will share data with third-party providers.





) concluded at 1.3474, followed by a corrective rally in wave ((ii)) that ended at 1.3569. The pair then resumed lower in wave ((iii)), reaching 1.3335, before a modest rally in wave ((iv)) concluded at 1.34. Price action now suggests that wave ((v)) is nearing completion, which should finalize the cycle from the August 21 high. Once this impulse ends, the pair is expected to stage a three‑wave corrective rally to retrace the decline before resuming its broader bearish trend.)