


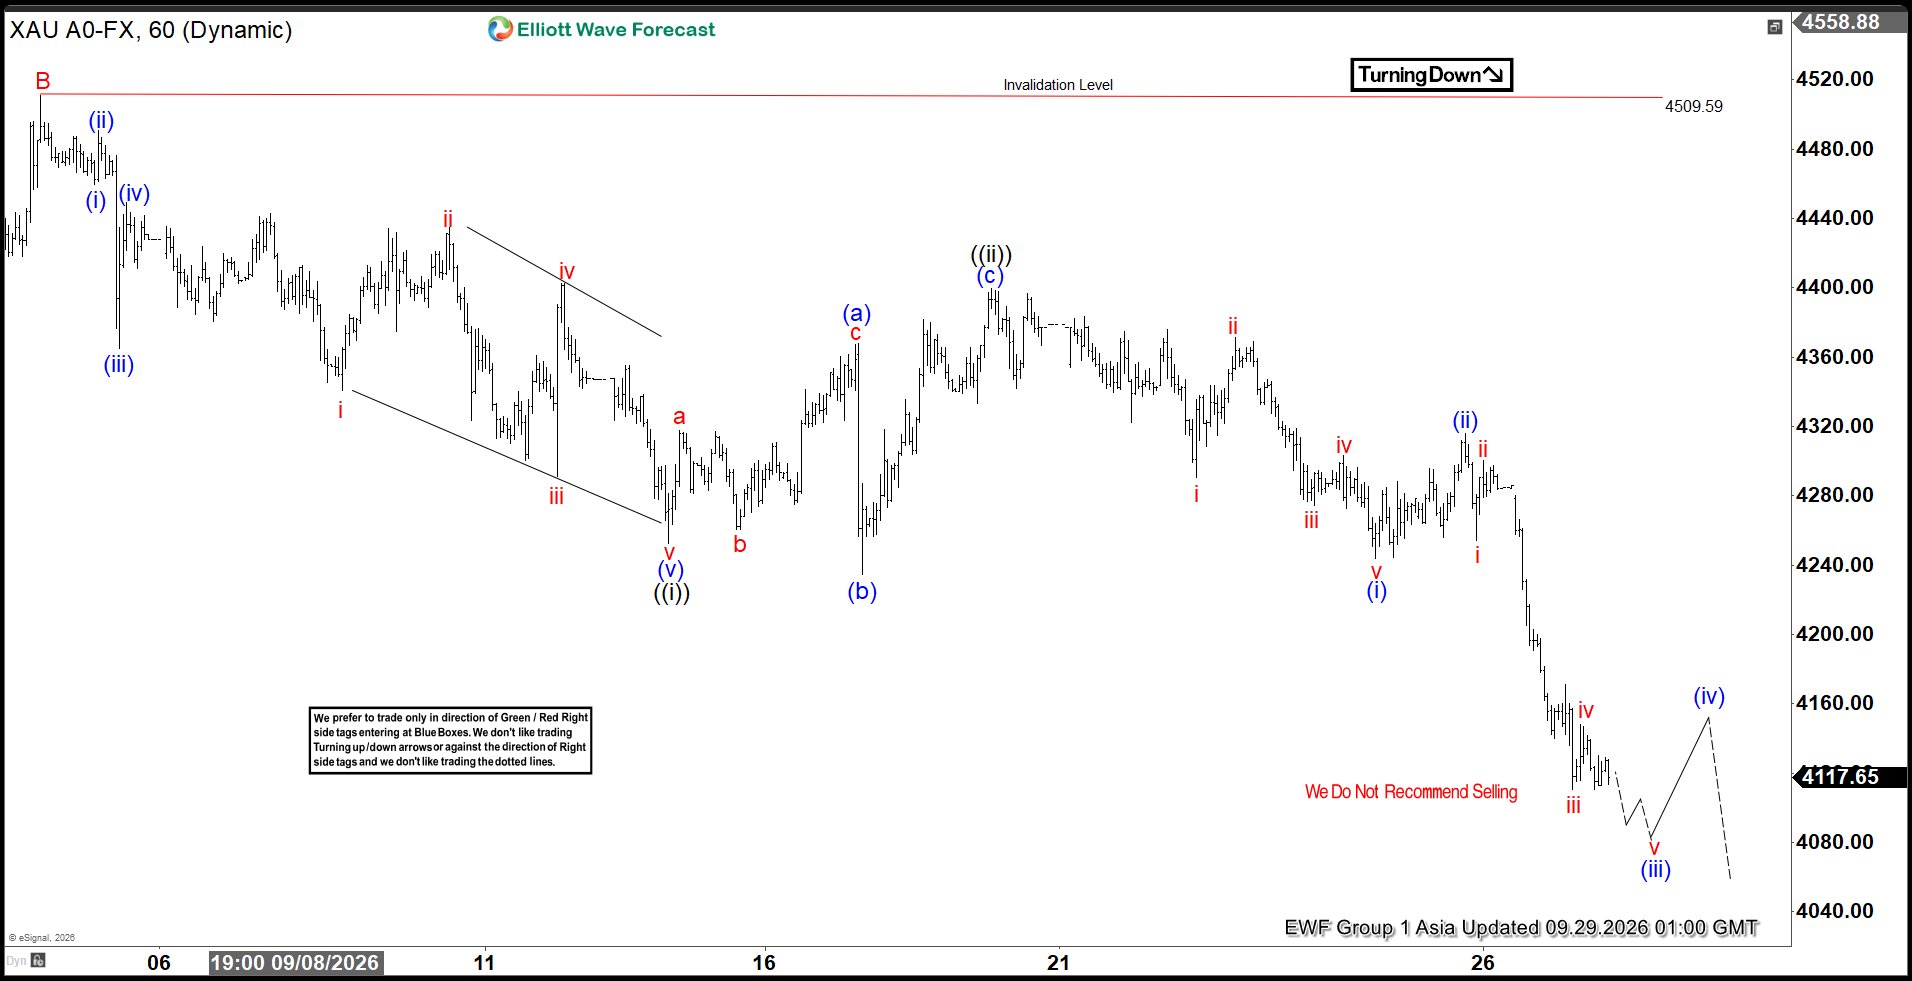
The short‑term Elliott Wave view in Gold (XAUUSD) indicates that the cycle from the August 25, 2026 high is unfolding as a zigzag corrective structure. From the August 25 peak, wave A concluded at $4282.23, followed by a rally in wave B that terminated at $4509.59. The metal has since resumed its decline in wave C, which is subdividing into a five‑wave impulse pattern. This development highlights the continuation of corrective pressure within the broader structure.
From the peak of wave B, wave ((i)) ended at $4252.70, while the subsequent rally in wave ((ii)) concluded at $4399.58 in the form of an expanded flat. The market then turned lower again in wave ((iii)), which itself subdivides into another five‑wave sequence of lesser degree. Within this decline, wave (i) ended at $4243.94, and the rally in wave (ii) terminated at $4315.82. The metal has resumed its downward trajectory within wave (iii) of ((iii)), reinforcing the impulsive nature of the correction. In the near term, as long as the pivot at $4509.59 remains intact, rallies are expected to fail in either three or seven swings. This failure should lead to further downside, ultimately completing the zigzag structure.
Gold 60 Minute Elliott Wave Chart
XAUUSD Elliott Wave Video
You are currently viewing a placeholder content from Default. To access the actual content, click the button below. Please note that doing so will share data with third-party providers.





 indicates that the cycle from the August 25, 2026 high is unfolding as a zigzag corrective structure...)