


Dow Jones Index: ⬆️ Buy
– Dow Jones Index reversed from support zone
– Likely to rise to resistance level 52550.00
Dow Jones Index recently reversed up from the support zone between the support level 50750.00, support trendline of the daily down channel from the start of August, lower daily Bollinger Band and the 38.2% Fibonacci correction of the upward impulse (1) from the start of April.
The upward reversal from this support zone completed the ABC correction (2) from the start of August.
Given the clear daily uptrend, Dow Jones Index can be expected to rise further toward the next resistance level 52550.00 – former support from the start of September, which stopped earlier wave iv.
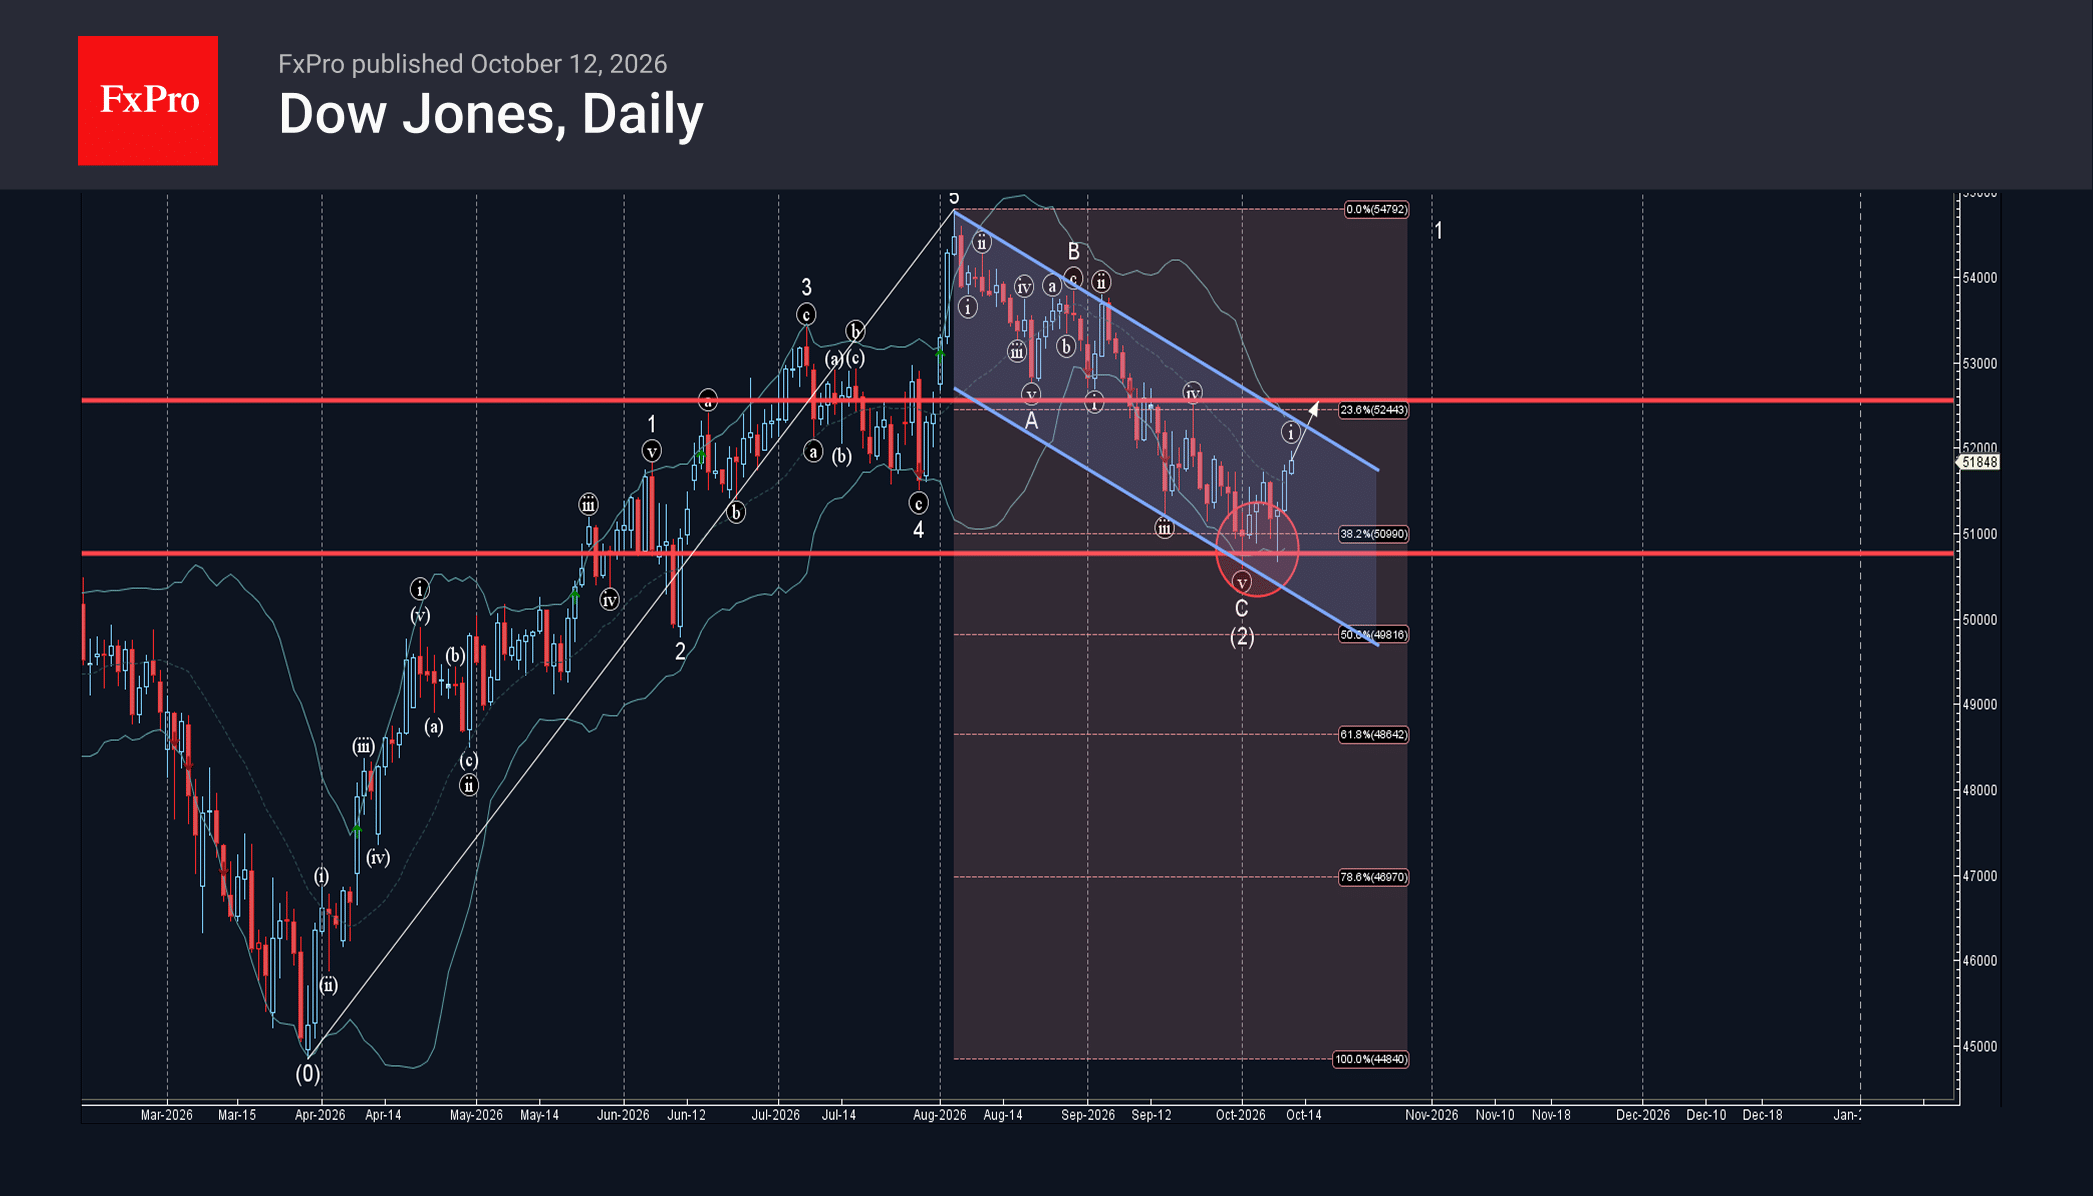





 from the start of April.)