

Hello, fellow traders,
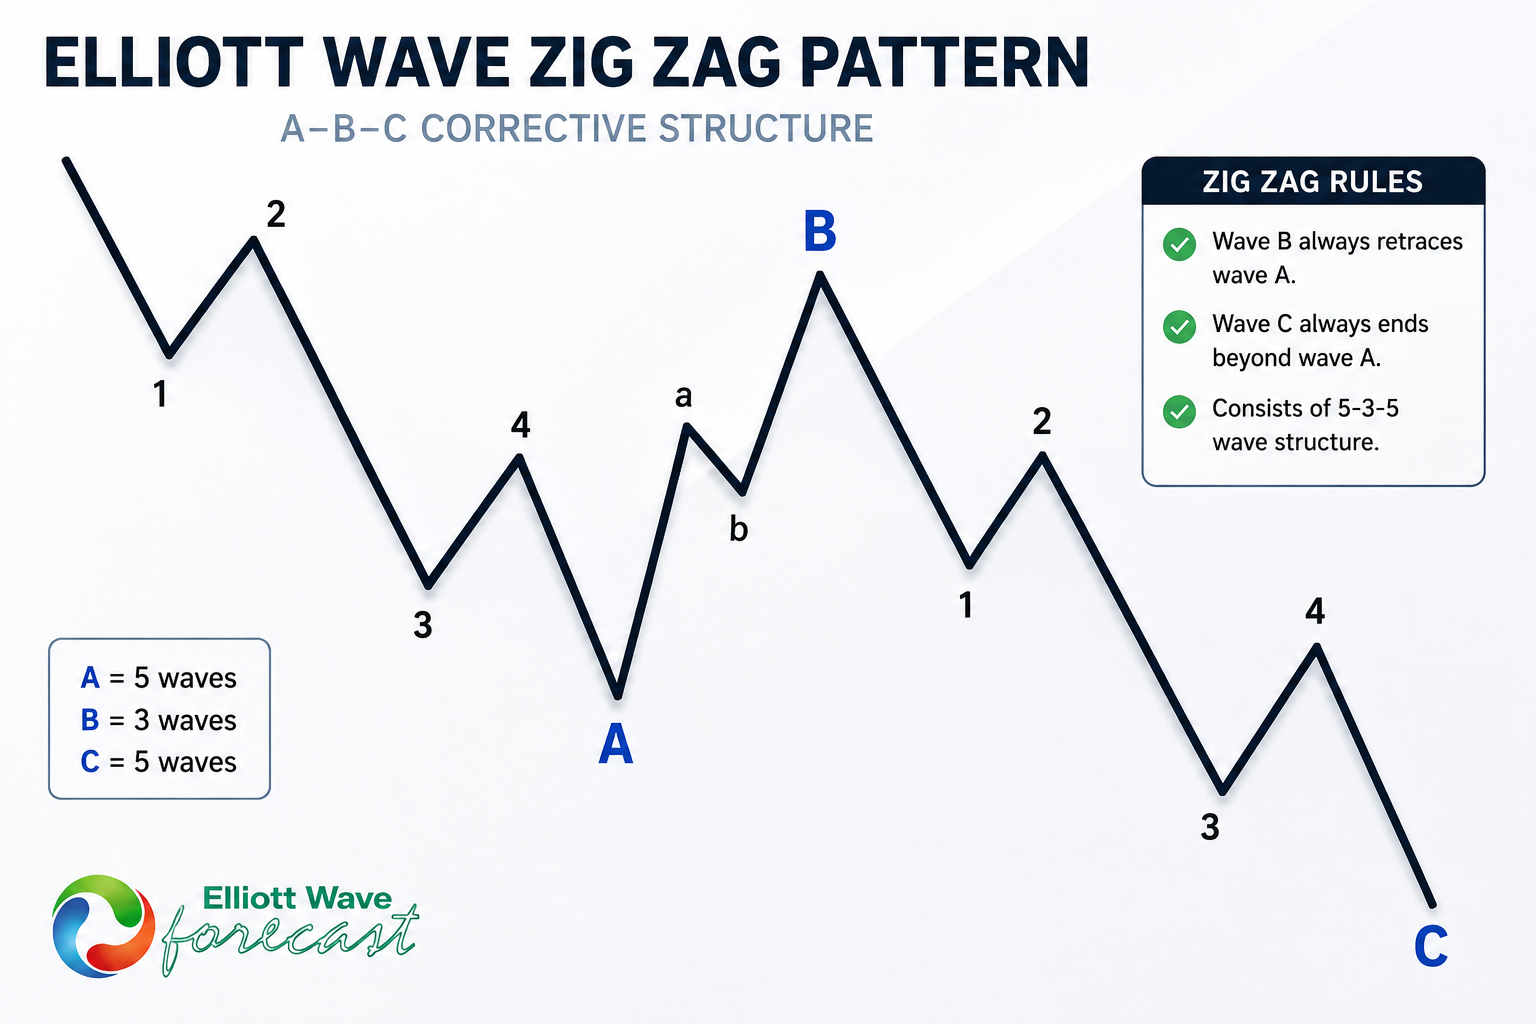
In this technical article, we’ll take a look at the Elliott Wave charts for the FTSE Index. The FTSE recently completed a Zig Zag correction at the Equal Legs area, where buyers stepped in and triggered a bounce. In the following sections, we’ll break down the Elliott Wave structure, discuss the current outlook, and explain the pattern behind the recent price action. Before diving into the FTSE chart, let’s briefly review the Elliott Wave Zig Zag pattern.
Elliott Wave Zigzag is the most popular corrective pattern in Elliott Wave theory . It’s made of 3 swings which have 5-3-5 inner structure. Inner swings are A,B,C where A =5 waves, B=3 waves and C=5 waves. That means A and C can be either impulsive waves or diagonals. (Leading Diagonal in case of wave A or Ending in case of wave C) . Waves A and C must meet all conditions of being 5 wave structure, such as: having RSI divergency between wave subdivisions, ideal Fibonacci extensions and ideal retracements.
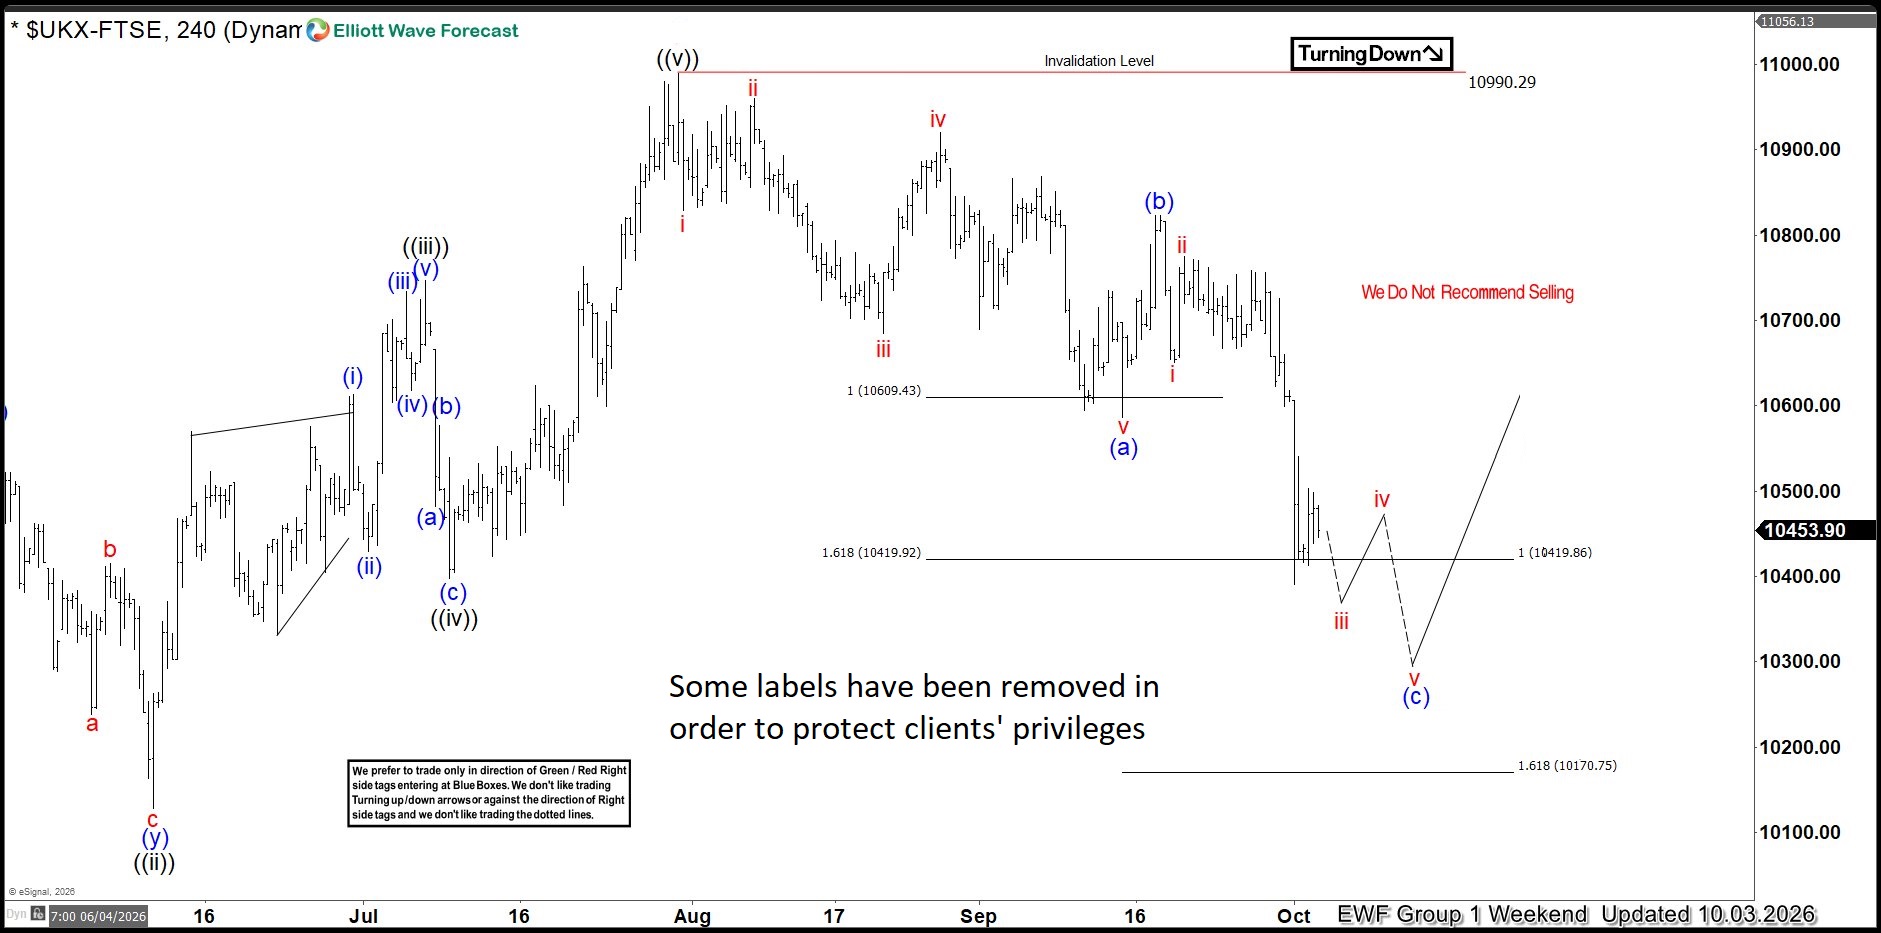
FTSE 4-Hour Elliott Wave Analysis 10.03.2026
We could clearly identify a five-wave structure in the first leg of the pullback, wave (a) blue, followed by a three-wave bounce in wave (b). The FTSE Index was then developing wave (c), which was expected to subdivide into five waves as well. At that moment we could count only 3 waves which meaned (c) leg is incomplete.
With wave (c) still incomplete, we were looking for a bounce in wave iv red, followed by one final push down in wave v. Using the Fibonacci extension tool to project wave (a) relative to wave (b), we identified the buyers’ zone between 10419.86 and 10170.75.
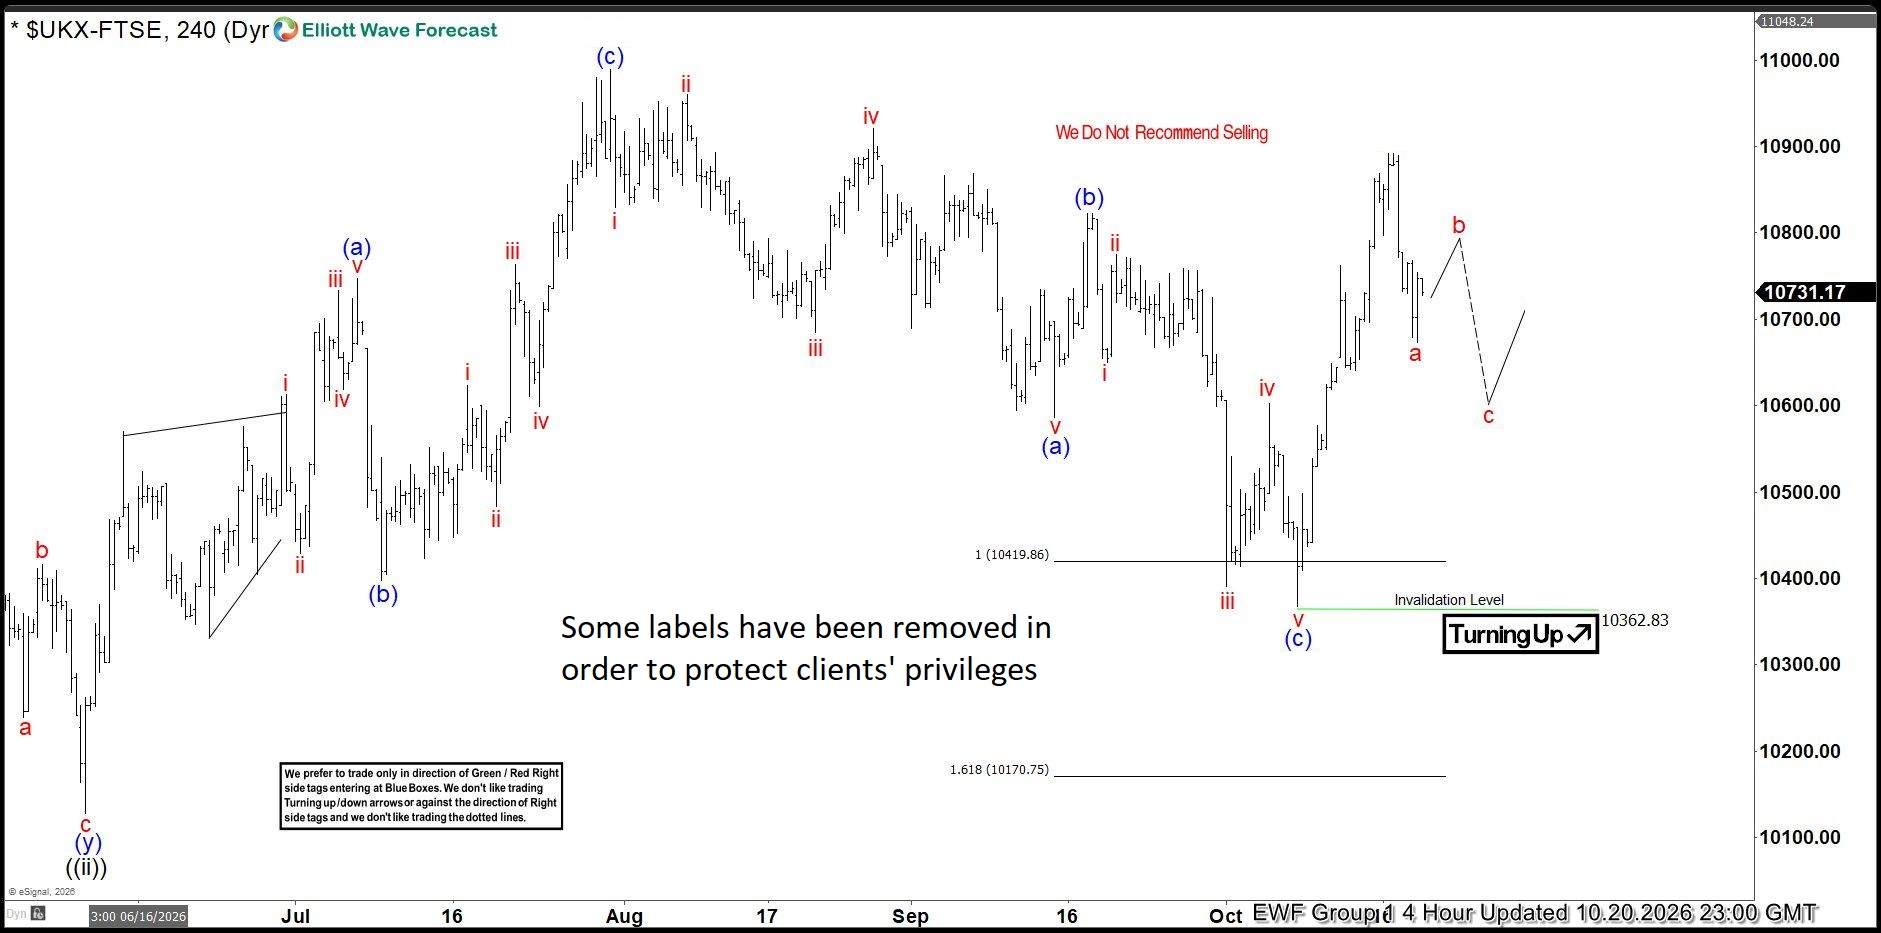
FTSE 4-Hour Elliott Wave Analysis 10.20.2026
As expected, the FTSE bounced in wave iv red before making one final push lower in wave v red. This completed the five-wave structure of wave (c), allowing us to identify a clear 5-3-5 Elliott Wave pattern and confirm the completion of the Zig Zag correction. Buyers stepped in right at the Equal Legs area at 10419.86-10170.75, confirming the expected reaction from this key support zone. The FTSE completed its Zig Zag correction within this area and started moving higher.
Note: Some labels have been removed from the chart to protect our clients’ privileges.
Keep in mind that the market is dynamic, and the outlook may have changed in the meantime. Our member Chat Rooms are open 24 hours a day, Monday through Friday, on trading days, providing ongoing expert guidance on market trends and Elliott Wave analysis. Members can ask questions about market structure and technical setups at any time during trading days.