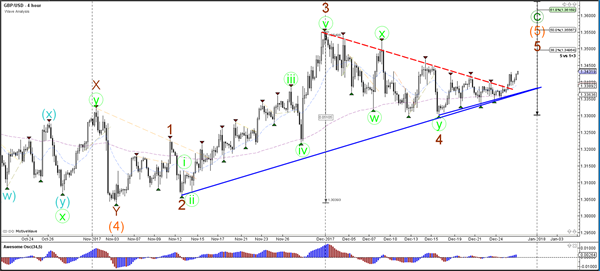
Currency pair GBP/USD
The GBP/USD broke the resistance (dotted red) of triangle chart pattern, which could be a bullish breakout within a wave 5 (brown) of wave C (green). The bullish break could see price move towards the Fibonacci targets of waves 5.
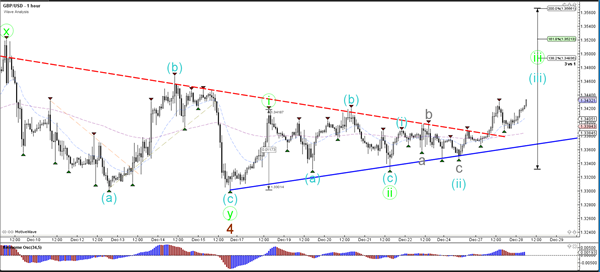
The GBP/USD has completed an ABC (blue) correction within a wave 2 (green/blue). The wave 3 becomes more likely if price manages to reach the 161.8% Fibonacci level.
Currency pair EUR/USD
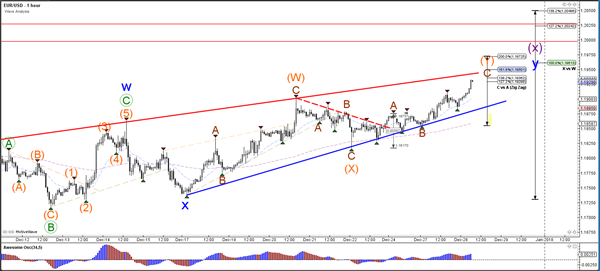
The EUR/USD broke above the local resistance trend line (dotted orange) and is moving higher towards the strong resistance zone (red lines). The chart is also building a rising wedge chart pattern (red/blue lines). A bullish breakout could indicate a continuation of the uptrend whereas a bearish reversal could send the EUR/USD lower to test the wave 2 vs 1 (pink) and the Fib levels of wave Y (purple).
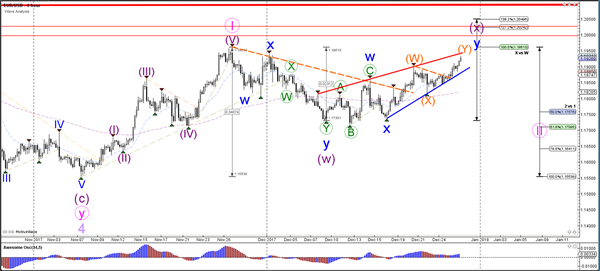
The EUR/USD is testing the Fibonacci levels of wave Y (orange) and the resistance trend line (red) of the rising wedge pattern.
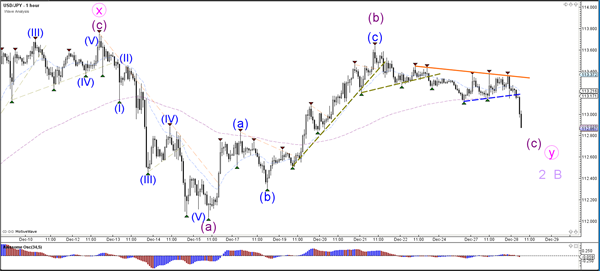
Currency pair USD/JPY
The USD/JPY broke below the support trend line (dotted blue) which could indicate a larger bearish wave C (purple) correction within wave 2 or B (light purple).
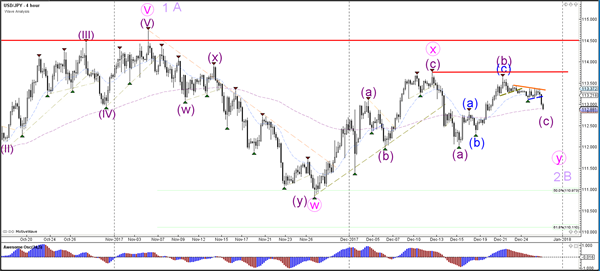
The USD/JPY bearish breakout could see price retest the support levels around 112.