


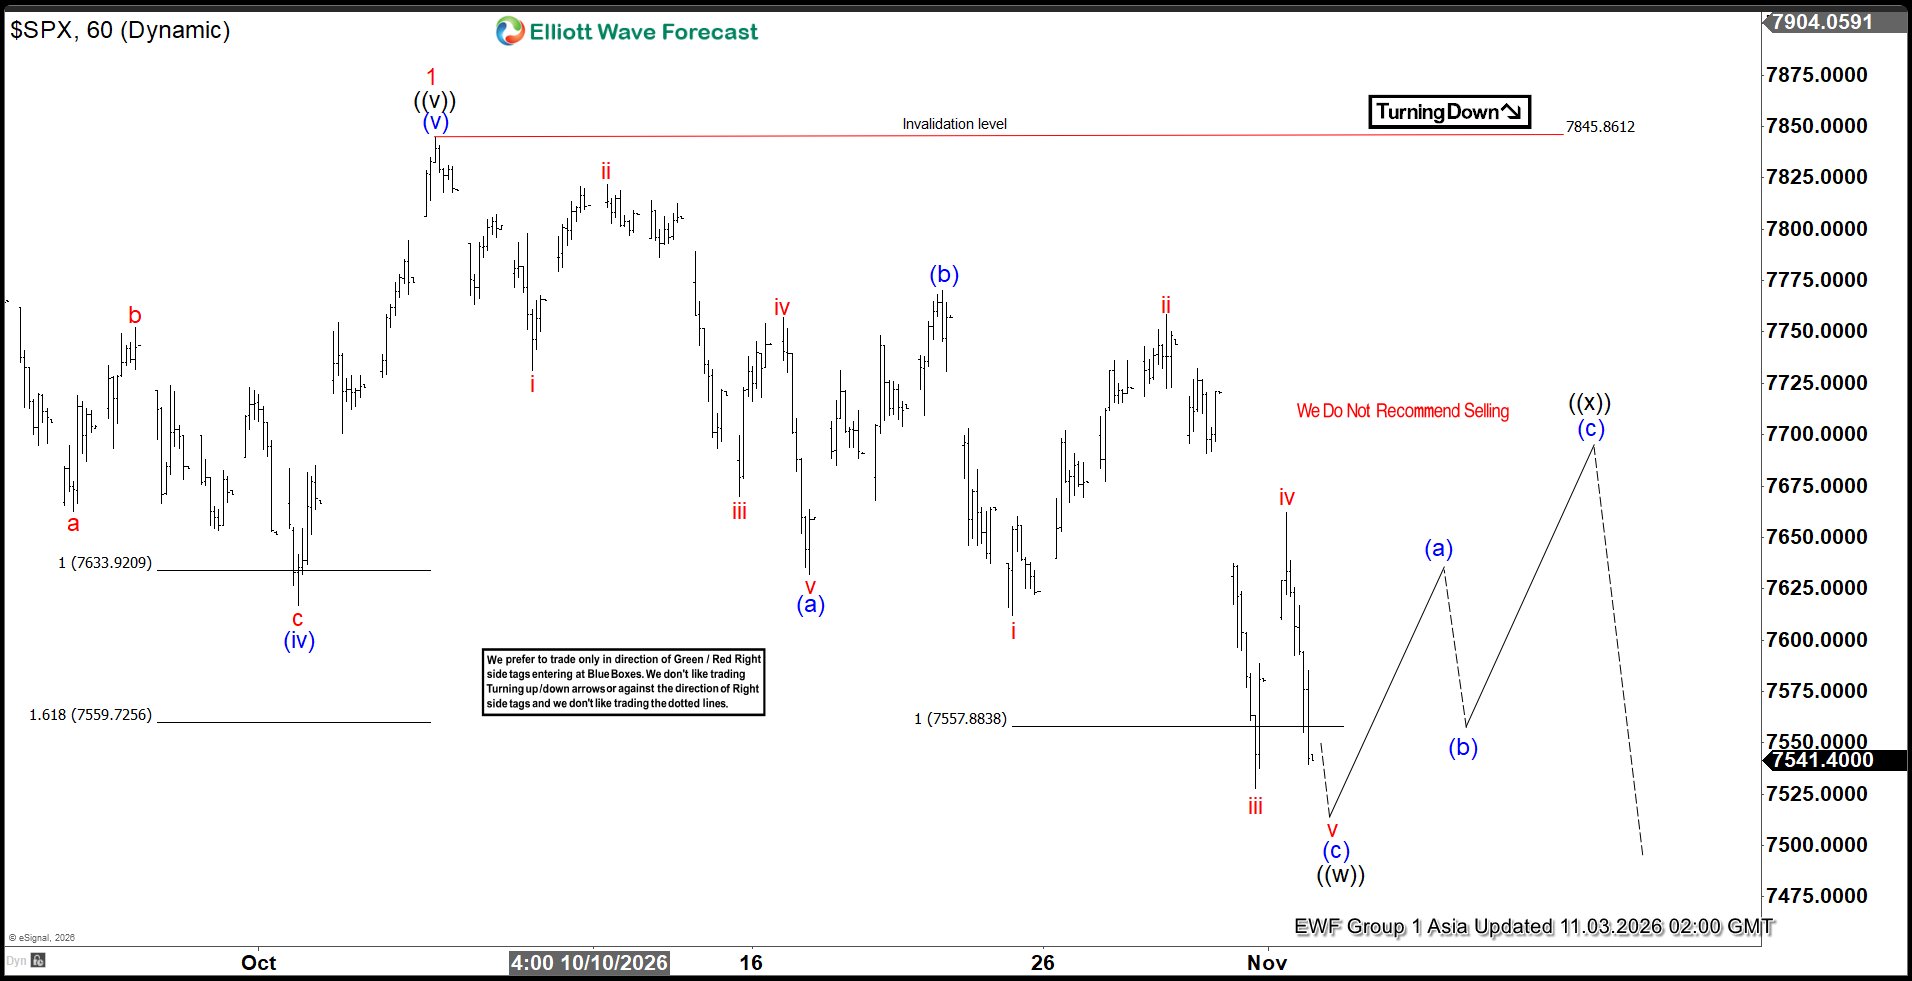
The Elliott Wave outlook for the S&P 500 (SPX) suggests that the cycle from the March 30, 2026 low completed wave 1 at 7845.6. The 1-hour chart displays a clear impulsive advance into that peak. This price action confirms the end of the initial bullish sequence. After completing wave 1, the index entered a wave 2 pullback. This correction should retrace the advance in a larger-degree 3, 7, or 11-swing structure.
At present, wave (2) continues to unfold as a double three Elliott Wave pattern. Within this structure, wave ((w)) approaches completion and should finish within the 7426-7557 support area. This region could attract buyers and slow the current decline. As selling pressure fades, the market may begin the next corrective phase.
Once wave ((w)) ends, the index should rally in wave ((x)). This bounce should correct part of the decline from the October 6, 2026 wave 1 peak. However, this recovery rally is just a corrective move rather than the start of a new bullish cycle. After wave ((x)) completes, sellers are likely to regain control and push prices lower in wave ((y)). That decline should extend the broader wave (2) correction.
In the near term, the 7845.8 pivot remains the key resistance level. As long as price stays below this peak, the corrective structure should remain intact. Buyers may generate short-term rallies, but those advances are likely to unfold in 3, 7, or 11 swings. Consequently, the market should face renewed selling pressure after each rebound. The path of least resistance therefore remains lower until wave (2) reaches completion and creates the foundation for the next larger-degree advance.
S&P 500 (SPX) 60 Minute Elliott Wave Chart
 SPX Elliott Wave Video
You are currently viewing a placeholder content from Default. To access the actual content, click the button below. Please note that doing so will share data with third-party providers.





 suggests that the cycle from the March 30, 2026 low completed wave 1 at 7845.6. The 1-hour chart displays a...)