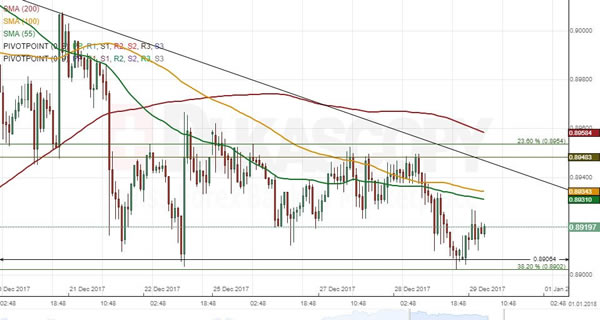
The New Zealand Dollar has been trading in an ascending channel against the Canadian Dollar since mid-November. The upper boundary of this pattern was tested on November 18 that was followed by a new wave down. The Kiwi has stopped near the 0.8906 on various occasions, thus forming a descending triangle. Characteristics of both patterns suggest that the Kiwi should soon enter a period of appreciation. It is likely that the triangle continues to prevail in this session and early on Monday, as the pair has not yet reached the bottom channel boundary located circa 0.89. This trading session is expected to be relatively quiet. Thus, it is unlikely that the combined resistance of the 55– and 100-hour SMAs is breached; the 0.89 area should likewise hold. The base scenario favours strengthening of the Kiwi during next week.