
A note on lower timeframe confirming price action…
Waiting for lower timeframe confirmation is our main tool to confirm strength within higher timeframe zones, and has really been the key to our trading success. It takes a little time to understand the subtle nuances, however, as each trade is never the same, but once you master the rhythm so to speak, you will be saved from countless unnecessary losing trades. The following is a list of what we look for:
- A break/retest of supply or demand dependent on which way you’re trading.
- A trendline break/retest.
- Buying/selling tails … essentially we look for a cluster of very obvious spikes off of lower timeframe support and resistance levels within the higher timeframe zone.
- Candlestick patterns. We tend to only stick with pin bars and engulfing bars as these have proven to be the most effective.
EUR/USD
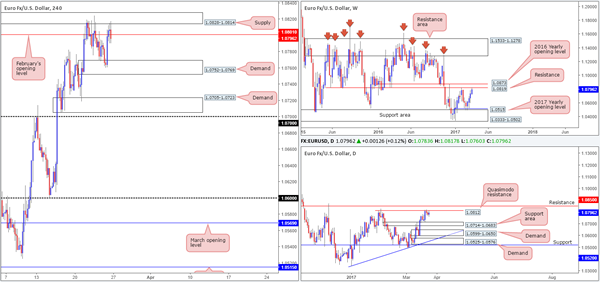
Weekly gain/loss: + 58 pips
Weekly closing price: 1.0796
Trade update: Trade taken from 1.0783 was taken out at breakeven. See Friday’s report for details.
Weekly bulls printed a fourth consecutive bullish candle last week, consequently forcing the pair to shake hands with resistance coming in at 1.0819. The minor end-of-week correction seen from here suggests that the bears may attempt to bring price back down to the 2017 yearly opening level at 1.0515/support area at 1.0333-1.0502 in the coming weeks.
In conjunction with the weekly timeframe, daily price has been seen teasing the underside of a Quasimodo resistance level at 1.0812 (planted seven pips below the above noted weekly resistance line) since Tuesday. Also noteworthy here is that Thursday/Friday’s candles printed a bullish engulfing pattern. However, this may not amount to much buying given the structure seen overhead! With that in mind, the next downside target in view can be seen around the support area formed at 1.0714-1.0683.
Bolstered by a string of upbeat Eurozone PMI figures on Friday, the H4 chart shows demand at 1.0752-1.0769 managed to elbow its way into the spotlight. The rally from here saw price retest the supply at 1.0828-1.0814, and end the day chalking in a reasonably sized bearish rotation candle that closed beyond February’s opening base line at 1.0801.
Our suggestions: With both the weekly and daily charts displaying resistance, along with the recent H4 candle close mentioned above, we feel the sellers may make an appearance today and likely bring price down to at least the aforementioned H4 demand. The only drawback here, of course, is the distance seen between the monthly level and the H4 demand (30 pips). Therefore, in order to keep risk/reward in one’s favor, we’d advise drilling down into the lower timeframes and trying to pin down a sell setup (see the top of this report for ideas on high-probability sell signals).
Data points to consider: German IFO business climate survey at 8am. FOMC member Evans speaks at 5.15pm, as well as FOMC member Kaplan taking the stage at 10.30pm GMT.
Levels to watch/live orders:
- Buys: Flat (stop loss: N/A).
- Sells: 1.0801 region ([waiting for a lower-timeframe signal to form is advised before pulling the trigger] stop loss: dependent on where one confirms this area).
GBP/USD:
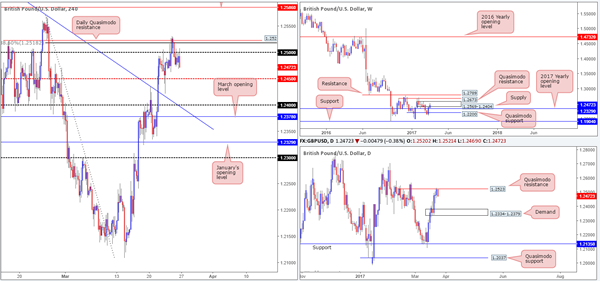
Weekly gain/loss: + 82 pips
Weekly closing price: 1.2472
Despite weekly price boasting its second consecutive weekly gain last week, the pair is now seen trading within the walls of a supply zone visible at 1.2569-1.2404. Another key thing to note here is the closing candle’s end-of-week correction! In the event that the bears pull the unit lower this week, price will likely find a pocket of bids sitting nearby the 2017 yearly opening level at 1.2329.
Seen within the current weekly supply zone is a daily Quasimodo resistance level drawn from 1.2523, which managed to hold price lower on Friday. The full-bodied bearish candle seen from here may be enough to entice sellers into the market to bring the unit down to demand at 1.2334-1.2379 (located a few pips above the aforementioned 2017 yearly opening level).
As can be seen from the H4 chart, the daily Quasimodo resistance line is also reinforced with an 88.6% retracement seen at 1.2518. For those who read Friday’s report you may recall that our team recommended waiting for a H4 close to form beyond the 1.25 handle before considering shorts. This took place going into the early hours of Friday’s segment, with 1.25 holding beautifully as resistance throughout the day. In fact, the week ended printing a nice-looking full-bodied bearish candle from this number!
Our suggestions: Depending how the market opens today, we would consider jumping in short. In light of the higher-timeframe resistance in play right now, the nearby H4 mid-way support at 1.2450 will likely be taken out and price could connect with 1.24, which happens to be our first take-profit target.
Data points to consider: FOMC member Evans speaks at 5.15pm, as well as FOMC member Kaplan taking the stage at 10.30pm GMT.
Levels to watch/live orders:
- Buys: Flat (stop loss: N/A).
- Sells: Potential shorts at the open (stop loss: 1.2510).
AUD/USD
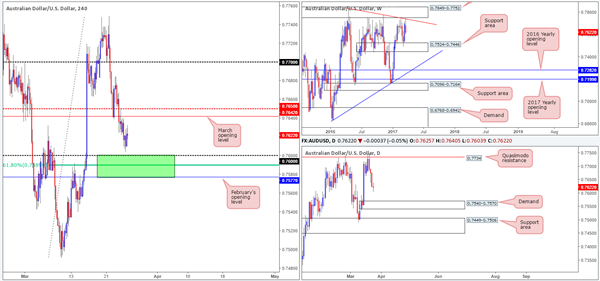
Weekly gain/loss: – 80 pips
Weekly closing price: 0.7622
After crossing paths with the underside of a weekly trendline resistance taken from the high 0.7835, the bears pushed the commodity-linked currency lower last week. On the condition that this pair remains in the red, the next port of call can be seen at 0.7524-0.7446: a weekly support zone.
Climbing down to the daily chart, we can see that the buyers and sellers ended the week forming an indecision candle. Be that as it may, there’s still room seen for further downside this week until we connect with the demand base coming in at 0.7540-0.7570 (positioned just ahead of the aforementioned weekly support area).
Looking across to the H4 candles, a rather interesting area (painted in green) of support has recently caught our eye. It comprises of February’s opening level at 0.7577, a 61.8% Fib support at 0.7589 and the 0.76 handle. What is also notable from here is that the aforementioned daily demand sits only 7 pips below this zone! Therefore, one should prepare for the possibility of a fakeout here!
Our suggestions: While our team is interested in buying from the above noted H4 buy zone, we would prefer to enter long within the lower limits of its range. That way, we can place stops beyond the daily demand! Should price reach this point and print a reasonably sized H4 bullish rotation candle, then our team would, if we’re not in on any other trades at the time, look to buy from here, targeting March’s opening level at 0.7642 as an initial take-profit target.
Data points to consider: RBA Assistant Gov. Debelle speaks today at 10pm. FOMC member Evans speaks at 5.15pm, as well as FOMC member Kaplan taking the stage at 10.30pm GMT.
Levels to watch/live orders:
- Buys: 0.7577/0.76 ([waiting for a reasonably sized H4 bullish candle to form before pressing the buy button is advised] stop loss: Ideally beyond the trigger candle).
- Sells: Flat (stop loss: N/A).
USD/JPY:
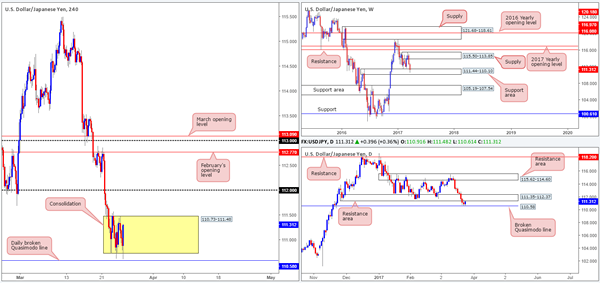
Weekly gain/loss: – 138 pips
Weekly closing price: 111.31
The USD/JPY sustained further losses last week, resulting in weekly action testing the support area fixed at 111.44-110.10. Providing that this barrier holds firm, the next zone of interest seen overhead falls in around the supply area drawn from 115.50-113.85.
Since Wednesday’s close, the daily candles have been sandwiched between a broken Quasimodo line at 110.58 and a resistance area marked at 111.35-112.37. Before our desk can become buyers (medium term) from the current weekly support area, this daily resistance area will need to be taken out.
A brief look at recent dealings on the H4 chart shows that price has recently entered into a phase of consolidation between 110.73/111.48 (yellow area). Directly beneath this zone sits the daily broken Quasimodo line at 110.58, whereas above the base, we have the 112 handle in view.
Our suggestions: Based on the above points, we would not really feel comfortable attempting to trade the current H4 range. We would, however, be interested in buying should a H4 close form above this consolidation, along with a retest to the top edge as support, targeting 112 as an initial take-profit target. Whilst this setup has the backing of the weekly support area, let’s also remember that by entering long here you are still effectively buying into a daily resistance area! Therefore, we would advise being extra aggressive managing the trade here.
Data points to consider: FOMC member Evans speaks at 5.15pm, as well as FOMC member Kaplan taking the stage at 10.30pm GMT.
Levels to watch/live orders:
- Buys: Watch for H4 price to engulf the 111.48 level and then look to trade any retest seen thereafter (stop loss: ideally planted beyond the rejection candle’s tail).
- Sells: Flat (stop loss: N/A).
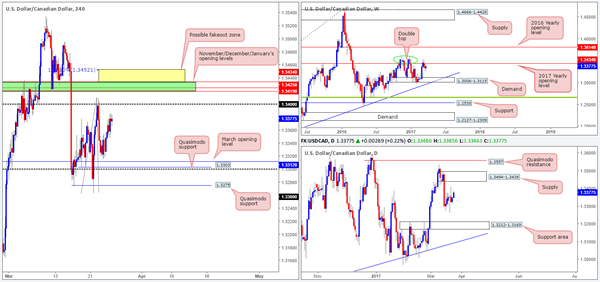
USD/CAD
Weekly gain/loss: + 35 pips
Weekly closing price: 1.3377
Following the selloff seen from the 2017 yearly opening level at 1.3434 two weeks back, weekly price responded with a round of buying from a low of 1.3263 last week. Technically speaking, this could encourage further buying this week back up to the yearly level. Daily flow on the other hand, offers very little in terms of direction at the moment. The unit is seen meandering mid-range between a supply coming in at 1.3494-1.3439 and a support area at 1.3212-1.3169.
Looking at Friday’s action on the H4 chart reveals that although the pair posted a gain, there was little change seen to structure. The next resistance target on tap can be seen at the 1.34 handle, followed closely by 1.3434/1.3419 (November, December and January’s opening levels marked in green). It might also be worth noting that above here there is a possible fakeout area painted in yellow at 1.3452/1.3434 (the top edge denotes a 127.2% Fib ext. taken from the low 1.3263), which happens to register nicely with the lower limits of the aforementioned daily supply.
Our suggestions: We still have a keen interest in The H4 1.3434/1.3419 region for shorts. Here’s why:
Of note is the 1.34 handle. Psychological levels are prone to fakeouts, and with 1.3434/1.3419 lurking just above 1.34, we feel it’d be a fantastic barrier to help facilitate a fakeout.
When these monthly levels converge, we typically find that they hold firm the majority of the time offering at least a bounce.
In that these monthly levels form a rather small zone, however, and with a somewhat attractive H4 fakeout zone seen above it (attractive due to it being located within daily supply) there is also a chance that price could whipsaw through the monthly levels before turning lower.
To short, we are looking for a H4 bearish selling wick to form that pierces into our pre-determined H4 yellow zone discussed above. With this, shorts would be a valid call from this region, in our opinion. From this point, 1.34 could be a potentially troublesome level, so we’d be looking for this base to be consumed, which would in turn be our cue to reduce risk to breakeven.
Data points to consider: FOMC member Evans speaks at 5.15pm, as well as FOMC member Kaplan taking the stage at 10.30pm GMT.
Levels to watch/live orders:
- Buys: Flat (stop loss: N/A).
- Sells: 1.3452/1.3419 ([watch for a H4 bearish selling wick to form within this range before considering a short] stop loss: ideally beyond the candle’s wick).
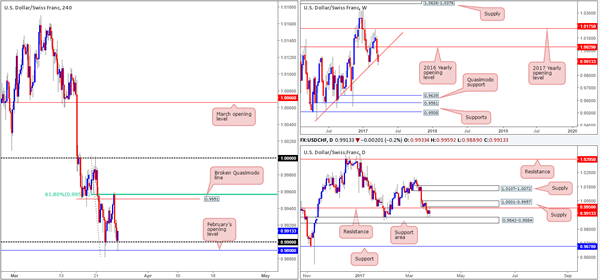
USD/CHF
Weekly gain/loss: – 66 pips
Weekly closing price: 0.9913
The steep descent seen over the past couple of weeks, shaped by two near-full-bodied weekly bearish candles, concluded trade last week closing below a weekly trendline support extended from low 0.9443. Providing that the bears continue to hold ground here, then the next support target does not come into view until the 0.9639 mark!
Down on the daily chart, nevertheless, price is seen capped between a supply zone at 1.0001-0.9957/resistance at 0.9950 and a support area pegged at 0.9842-0.9884. It would take a decisive close beyond this support area to convince us that price could be headed for the support line coming in at 0.9678, which sits only a few pips above the weekly support at 0.9639.
For those who read Friday’s report you may remember that we were interested in shorts from the H4 broken Quasimodo line at 0.9951, due to it converging with both a daily resistance pegged at 0.9950 and a H4 61.8% Fib resistance at 0.9956. As you can see, price responded beautifully to this zone and aggressively sold off. Well done to any of our readers who managed to pin down a trade here!
Our suggestions: Although the H4 candles caught a bid from February’s opening level at 0.9890 late Friday, our team is reluctant to buy from here given the recent weekly close. A H4 close beyond this monthly level, nevertheless, would be very interesting! To the left of H4 price, we do not see any active H4 demand until the 0.98 handle. Therefore, a H4 close below 0.9890, followed up with a sound retest as resistance would, in our opinion, be a high probability sell. Granted, by shorting here, you’d effectively be going up against daily buyers, but, as already mentioned, with little H4 demand being seen coupled with last week’s close, we feel this is worth the risk.
Data points to consider: FOMC member Evans speaks at 5.15pm, as well as FOMC member Kaplan taking the stage at 10.30pm GMT.
Levels to watch/live orders:
- Buys: Flat (stop loss: N/A).
- Sells: Watch for H4 price to engulf the 0.9890 level and then look to trade any retest seen thereafter (stop loss: ideally planted beyond the rejection candle’s wick).
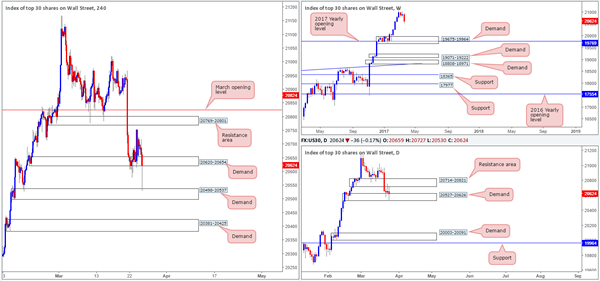
DOW 30:
Weekly gain/loss: – 288 points
Weekly closing price: 20624
Following a two-week consolidation around record highs, US stocks tumbled 300 points lower last week. Right now, there is very little weekly structure seen until the index crosses swords with demand at 19675-19964, which happens to intersect with the 2017 yearly opening level at 19769.
Despite weekly price suggesting further selling could be on the cards, the daily chart seems to be throwing up a red flag. Since Wednesday, the DOW has been consolidating between demand at 20527-20626 and a resistance area at 20714-20821. In addition to this, Friday’s movement chalked in an indecision candle with a slight edge seen going to the bears. A violation of this demand would likely open up the path south down to demand pegged at 20003-20091 (located just above the aforementioned weekly demand and daily support at 19964).
Jumping across to the H4 candles, we can see that the demand area at 20620-20654 remains intact, despite Friday’s vicious whipsaw through this zone down to a H4 demand at 20498-20537 (positioned around the underside of the daily support area). With stops likely weakened beyond 20620-20654, further downside is a real possibility today.
Our suggestions: However, we would not feel comfortable shorting this market until a H4 close is seen beyond the 20498-20537 zone. A close below here would not only likely clear bids out from the daily support area and further confirm strength on the weekly timeframe, but it would also open us some space down to the H4 demand base drawn in at 20381-20425.
Data points to consider: FOMC member Evans speaks at 5.15pm, as well as FOMC member Kaplan taking the stage at 10.30pm GMT.
Levels to watch/live orders:
- Buys: Flat (stop loss: N/A).
- Sells: Not considering sells until the H4 demand at 20498-20537 is consumed.
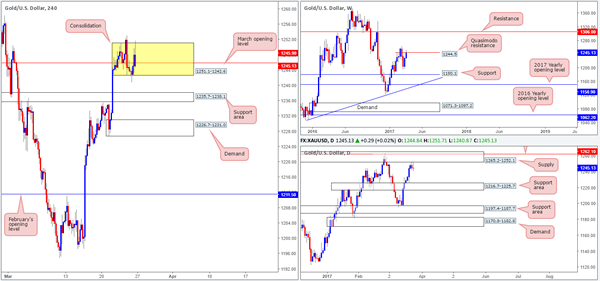
GOLD:
Weekly gain/loss: + $16
Weekly closing price: 1245.1
The gold market enjoyed another relatively successful week, reaching a high of 1253.0. Also of note on the weekly timeframe is price marginally closed beyond the Quasimodo resistance level at 1244.5. However, given that this close is considered minor on this scale, we believe this resistance still has a good chance of rotating price this week.
Turning our attention to the daily timeframe, the bears are seen responding relatively well to the supply zone printed at 1265.2-1252.1 (encapsulates a resistance level at 1262.1). This – coupled with the weekly Quasimodo resistance level in play right now could force bullion down to the daily support area penciled in at 1216.7-1225.7 sometime this week.
Since Wednesday, the yellow metal has been consolidating around March’s opening level at 1245.9 between 1251.1-1242.6 (yellow zone). Based on the higher-timeframe structure, a close below this range is likely. Still, to short here would be challenging with a H4 support area lodged just below at 1235.7-1238.1, followed relatively closely by a H4 demand area at 1226.7-1231.0 which is also located just above the aforementioned daily support area.
Our suggestions: Although the higher timeframes indicate that lower prices could be seen this week, nearby H4 structure is suggesting otherwise. With this in mind, remaining on the sidelines may very well be the better path to take today.
Levels to watch/live orders:
- Buys: Flat (stop loss: N/A).
- Sells: Flat (stop loss: N/A).


