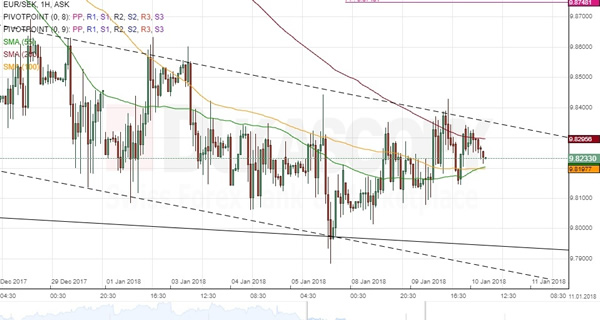
EUR/SEK has been trading in a channel up since late 2016. During its last wave down which started mid-December, the common European currency has likewise formed a falling wedge. It tested the bottom boundary of this pattern on January 5 and has since edged slightly higher. From technical point of view, the Euro should approach the upper wedge line in the 9.84/86 territory. Meanwhile, the pair has been currently stranded between the 55-, 100– and 200-hour SMAs in a diminishing trading range. It is likely that a breakout from this area would determine the subsequent direction. Technical indicators show that the southern barrier might surrender under the bearish pressure, thus possibly sending the Euro down to 9.76 area where the monthly S1 and the weekly S2 are located. An upside breakout, however, could result in a test of the 9.90 mark within the following week or more.