Currency pair EUR/USD
The EUR/USD bearish retracement seems to have ended after bouncing at the support zone and trend lines. The bearish wave C (blue) did not manage to break the bottom of wave A by much before price continued moving higher. The bullish break above the resistance trend line (red) is probably indicating the start of wave 5 (purple) but be aware that if price fails to break above 1.25, price could still expand the wave 4 (purple) via a WXY correction.
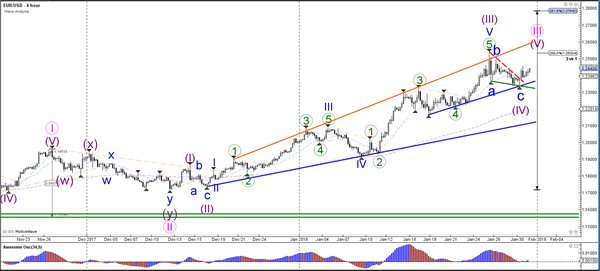
The EUR/USD needs to break above the local resistance line (red) before a potential wave 3 (blue) can start. A break below support (blue) could expand wave 2 (blue) or wave 4 (purple).
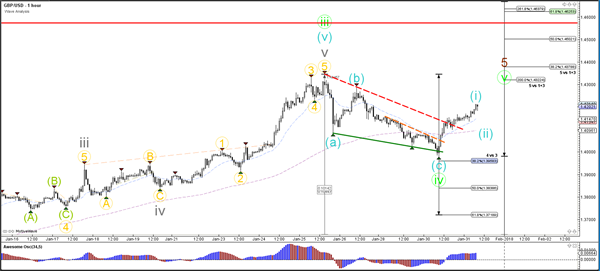
Currency pair GBP/USD
The GBP/USD bounced at the 38.2% Fibonacci retracement of wave 4 (green). The bullish breakout above the resistance trend line (dotted red) could indicate an uptrend continuation within wave 5 (green).
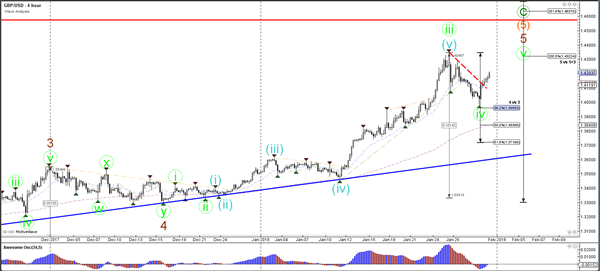
The GBP/USD could first build a pullback after the bullish breakout as part of a potential wave 1-2 pattern (blue).
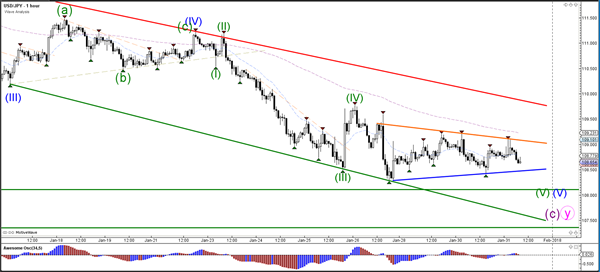
Currency pair USD/JPY
The USD/JPY is building a triangle corrective chart pattern as part of a larger downtrend. Price is also close to a strong support zone (green line) from the daily chart.
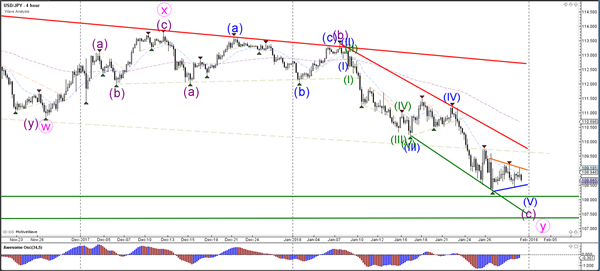
The USD/JPY remains in a triangle chart pattern. A bullish break above the pattern could indicate the end of the downtrend whereas a break below the support zone (horizontal green) could indicate a continuation of the downtrend.