
Is Bullish Momentum Gathering?
USDCAD has been climbing quite aggressively over the last couple of months, rising around 6.5% since the end of January and hitting levels last seen in June.
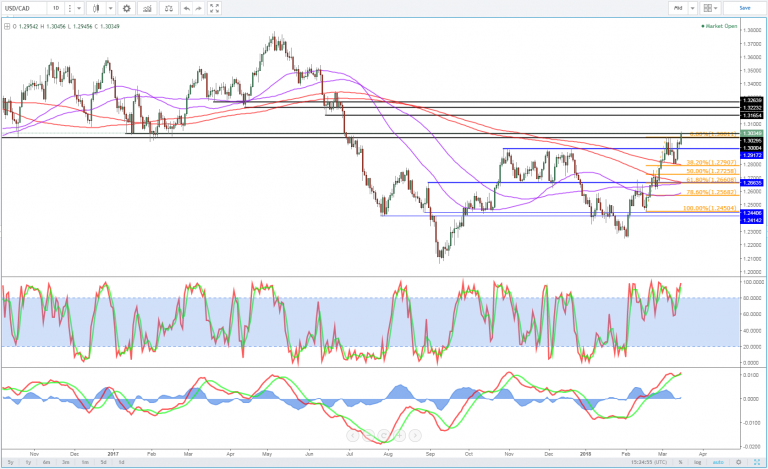
After running into resistance around 1.30 last week – a notable psychological level and important support late 2016 and early 2017 – the pair fell back to 1.28 where it found support from a combination of the 38.2% fib level and the 233-day simple moving average.
A shallow correction like this could be a sign of a very bullish market and with the pair having recently breached the 200 and 233-day SMAs, it joins a growing list of bullish indicators.
Should the pair hold onto today’s gains and close above 1.30, the next key technical levels above will be around 1.32, with it having found support around here last time it traded above between March and June last year. It’s worth noting though that 1.32 is not a precise level, the pair found support during these months roughly between 1.3165 and 1.3265.
One interesting thing about the recent rally has been the momentum indicators which aren’t fully supportive of price action. The MACD moving averages are making new highs, while the MACD histogram is making lower highs and the Stochastic is relatively neutral. This in itself isn’t really a bearish signal but it will be very interesting to see how these look should we reach the 1.32 zone.


