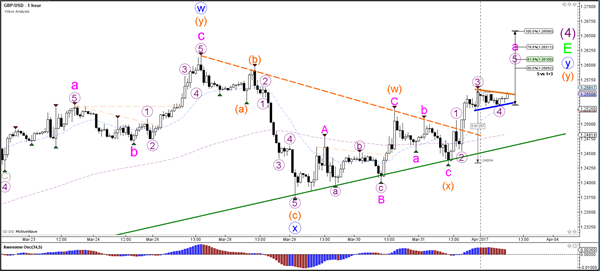
Currency pair GBP/USD
The GBP/USD broke above the resistance of the triangle (dotted orange) chart pattern, which makes it likely that a wave X (blue) has been completed. Price could be building a wave Y (blue) correction towards the Fibonacci targets.
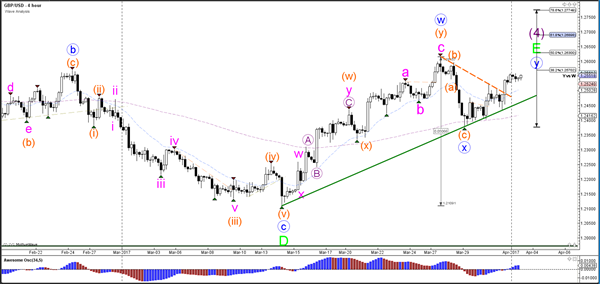
The GBP/USD broke above the resistance trend line (dotted orange). The breakout will probably turn out to be an ABC zigzag (pink). The trend lines are forming a contracting chart pattern and the current formation could be part of a wave 4 (purple) retracement.
Currency pair EUR/USD
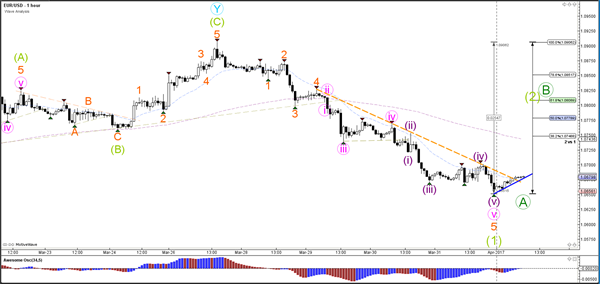
The EUR/USD showed strong bearish impulse which has been marked as either a wave 1 (light green) or wave A (dark green). Price is trying to break above the resistance trend line (orange), which could spark a retracement back to the Fibonacci levels for wave 2 or B.
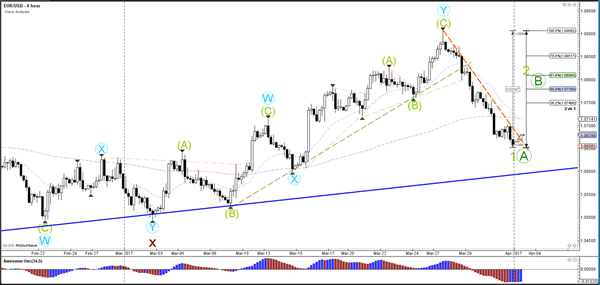
The EUR/USD break above resistance has been mild. A push above the 1.07 round resistance level could start a larger wave 2 or wave B retracement.
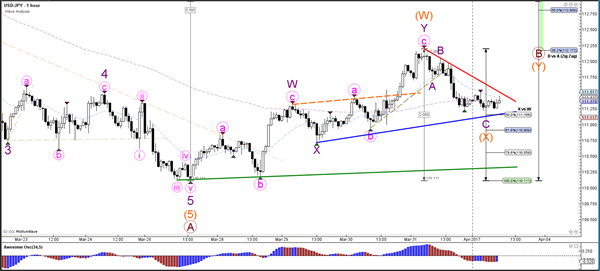
Currency pair USD/JPY
The USD/JPY indeed bounced at the 38.2% Fibonacci level of wave B vs A (brown). The current bearish price action could be part of a larger WXY (orange) correction within wave B (brown).
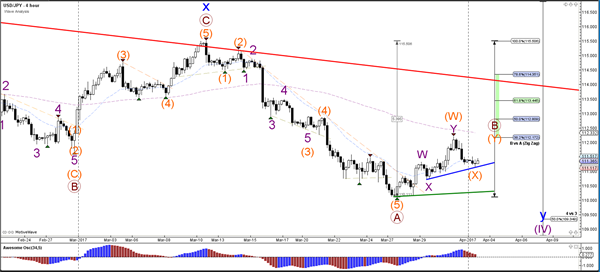
The USD/JPY seems to be building an ABC (purple) zigzag which is a corrective pattern. A break above the resistance trend line (red) would confirm a bullish breakout within wave Y (orange).