
I hope you had a good weekend. It seems that as traders, we’re perhaps the only people who look forward to Mondays.
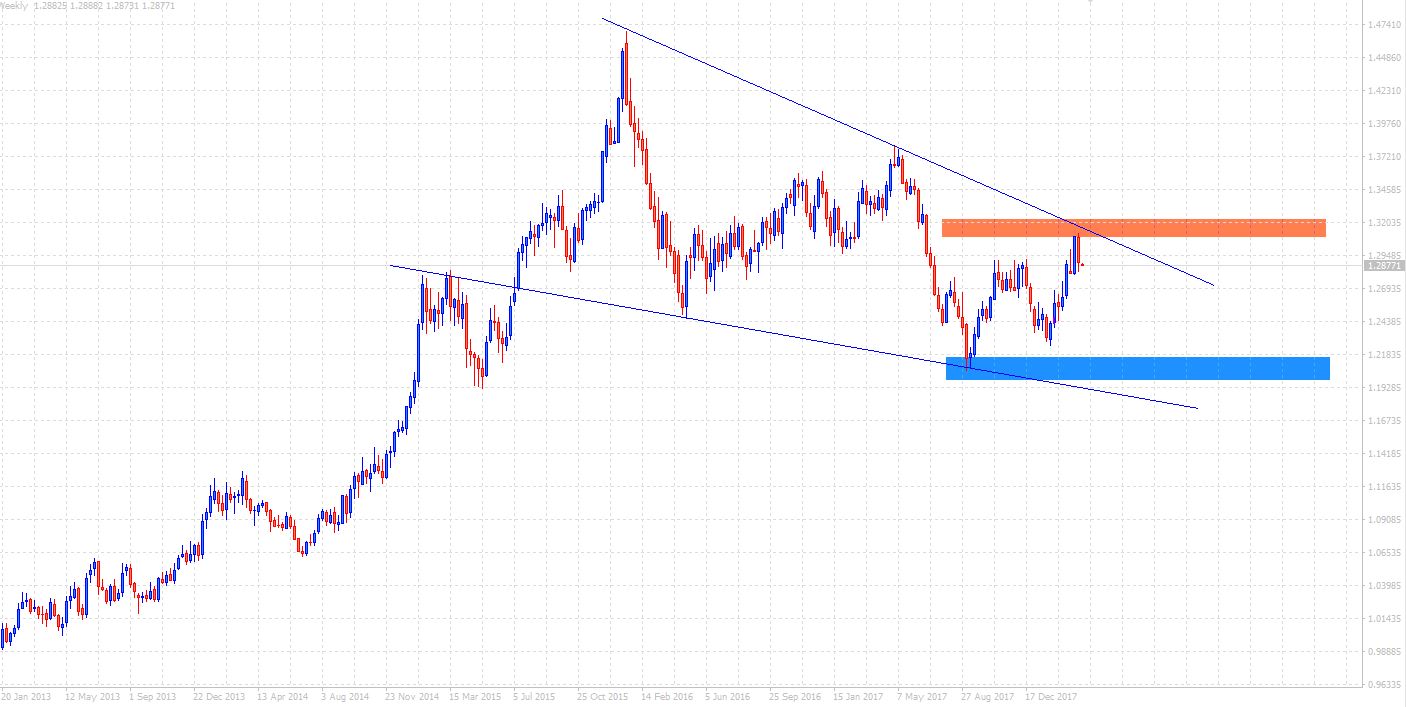
Skimming through some more charts over the weekend and came across a beauty. on the weekly chart of the USDCAD, we’ve got a nice wedge forming. This downward resistance seems to be quite strong as price has sharply rejected it, at least for now, and we’re presented with the potential for some further downside action.
Worthy of note is that we are at previous minor highs which may cause some stalling, however, we can potentially see price reach or breach the 1.24 levels or even further to where our blue support area lies.
Weekly chart below.
Now, consider the daily chart.
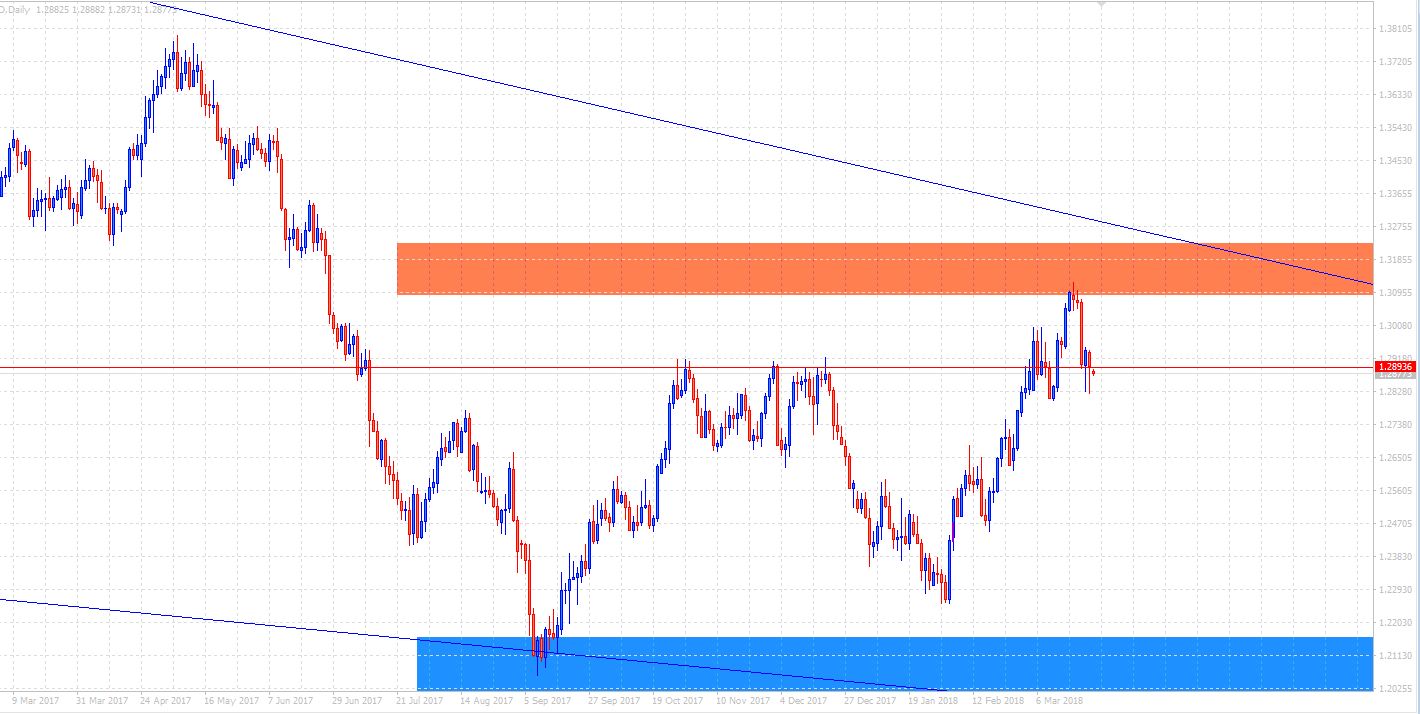
As you can see, price has momentarily stalled at old highs, and whilst there is potential for a bounce, price is still in a medium/long term correction.
Keep an eye for a convincing breach or bounce of these levels and evaluate from there.


